A SQL deadlock in Dynamics 365 occurs when two or more processes block each other by holding locks on resources the other processes need, causing a circular dependency that SQL Server cannot resolve without intervention. In the D365 context this typically arises during high-concurrency scenarios like batch jobs or heavy data imports where multiple threads compete for the same database rows or tables. The SQL engine resolves deadlocks by automatically terminating one of the conflicting transactions (the “victim”), which results in an error. In some situations, this also lead to DB fail and where sessions are moved to the secondary DB (That may not be scaled up as the primary DB)
So when experiencing sudden slowness and “strange” errors, please check in LCS for deadlocks like this, and start analyzing the call-stack.
One scenario I experienced when importing large sales orders in parallel, and where the sales orders have the same items. When having a lot of Commerce or EDI imports, it is common to place the entire sales order creation within the same transaction scope. Making sure that either is entire order is imported correct.
I would like to exemplify one specific instance that recently was identified together with Microsoft friends.
We experienced that frequently the D365 F&O started to be unstable and slow. And there where no clear indications of why. We could not repro. Customer reported sudden TTS errors, and that user get errors about losing connection to the DB. Typically, towards SysClientSessions.
Microsoft then carried out a deep analysis of telemetry, and the findings showed instances of frequent SQL failovers. Basically the DB failed, and the recovery mechanism moved the database sessions to fail-over DB clusters.
While going deeper, we found traces of deadlocks. It seems that DB architecture don’t like massive deadlocks, and when this happens, there are auto recovery mechanisms that kick-in to ensure up time and that users can continue to use the system.
In this specific instance the deadlock was caused by inserting a record table MCRPriceHistory, and the index RefRecIdIdx. This table is used for recording pricing details on the sales order. Finding deadlocks on insert are rare and a unicorn, and therefore I just had to write about is.
In this specific situation, there are two options :
1. Disable the Price History feature. (Unified pricing related), and wait for fix from Microsoft.
2. Create a support case to Microsoft, and ask for a index change on MCRPriceHistory, adding recid to the index RefRecIdIdx.
End note;
My main message to the community is to be aware of database deadlocks, as deadlock-escallation can have major impact on performance and may also trigger fail-safe mechanism in the Dynamics 365 architecture. And they are also very difficult to find and analyze. If you have deadlocks, please create a support case. I’m so grateful we as a partner have invested in Microsoft Premier Support, as this has been crucial to find root cause and final fix.
These notes show my personal learning and interpretations, and they are not official documentation from Microsoft. The goal is to offer a deeper look into how X++ code, the compiler, and the runtime work in Dynamics 365.
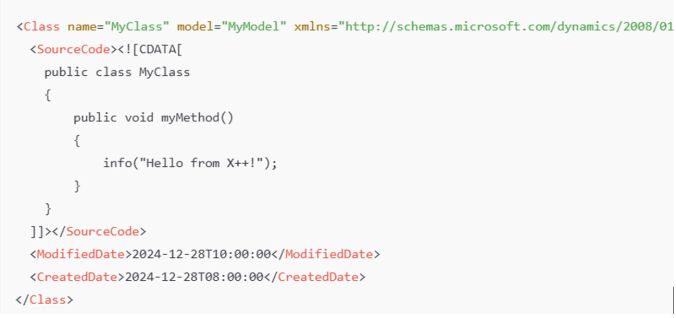
Where is the X++ code stored in the file system? X++ code resides in XML files that define classes, tables, forms, and other objects. These files are part of the application model’s metadata and appear in Visual Studio as X++ objects. Class Definition: Found as an XML file under \Classes\MyClass.xml.
Table Definition: Found as an XML file under \Tables\MyTable.xml, listing fields, methods, etc.
In a D365 10.0.42 codebase, the PackagesLocalDirectory contains approximately 542,091 files (about 17.69 GB). Of these, around 340,029 are XML files, representing the AOT (Application Object Tree).
What are the relationship between Models and Packages ? All code is placed into a model, which is essentially a design-time logical grouping of metadata and source files. You can see them on disk in a path like:
There are 171 models in the standard Microsoft codebase. Each model belongs to a package, which serves as the compilation and deployment unit. You can combine one or more packages into a deployable package for runtime.
Example The Application Suite model is the largest one, with 185,939 XML files, totaling 1.32 GB.
Compilation Output and .NET Components
Compiling X++ turns the application artifacts (X++ code, metadata, and resources) into deployable and executable components in .NET Intermediate Language (IL), which run under the CLR (Common Language Runtime). The compilation produces:
.dll files (the main assemblies)
.netmodule files (modules containing the IL code for X++ types)
.pdb files (debugging symbols, used primarily in development environments)
.md files (runtime metadata)
.netmodule files hold the actual IL code for each X++ type. If you open a form like SalesTable, all the required .netmodule files for that form must also be loaded.
.md files contain runtime metadata, classified by type (Class, Table, Form, etc.). They include only the essential metadata required at runtime (e.g., control hierarchies, table relationships), in contrast to the comprehensive XML files that exist only at design time. As a result, XML files are excluded when you deploy to sandbox or production.
.pdb files are for debugging and are not typically deployed to production.
How the Compilation Process Works
X++ code is first compiled into .netmodule files. The .netmodule files are then linked together to produce the final .dll file for the package. The .pdb file is generated alongside the .dll and holds debugging metadata.
The .netmodules also allows for incremental compilation, and you will thus often see multiple .netmodules files generated. But when you compile the entire smaller module, you will see that the .netModules are typically returned to one file. But for larger modules, like the Application Suite you can see that there are 276 .netmodules files. I suspect there are a limitation or optimalization to have the Application Suite splitted into multiple files.
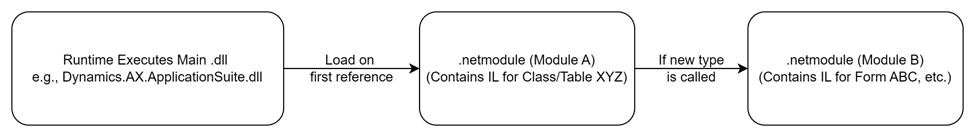
Runtime Execution and Loading Behavior When the system needs to run code:
The main .dll (e.g., Dynamics.AX.ApplicationSuite.dll) is loaded first.
The .netmodule files containing the needed X++ types (classes, forms, etc.) load on demand.
The runtime loads a specific .netmodule only when a type within it is first accessed. The first load includes overhead, such as initializing event handlers and chain-of-command (CoC). Subsequent calls to types in the same .netmodule do not incur the same cost.
How does this affect runtime behavior in relation to Cold vs. Warm Start
I guess most of us have experienced performance difference between cold and warm starts, and this is caused by runtime behaviors involving .netmodule files and object initialization.
At cold start:
When a class or object is accessed for the first time after an AOS restart, the runtime loads the .netmodule containing the class/object into memory. Static constructors and chain-of-command/event handlers are initialized and metadata required for the type is fetched and cached.
This initialization process can take significant time, especially for larger .netmodule files or types with complex dependencies.
To further explain, when opening the salesTable form can take up to 30s, as there are a lot of tables, classes, form elements that needs to be loaded also. And each of these may have extensions event handlers and chain-of-command. This results in an enormous amount of files to be accessed, loaded and initiated. In short, a domino effect of loading executable .netmodules happens. If you take a look at SalesTable, you realize the number of tables, extensions, modules and code that is packed together on a single form. I have not tried to understand or count the number of elements that go into loading this form, and here just showing number of extensions and tables you see in an extension of the Sales Table form.
During runtime, the system also builds and populates various caches (e.g., metadata, plugin, and event handler caches). Cache population may traverse large amounts of metadata, contributing to the cold-start delay.
At warm start:
After the .netmodule and associated handlers are loaded into memory, subsequent references to types in the same .netmodule are faster because the .netmodule is already in memory and metadata and handlers have been initialized. Opening the salesTable drops from 30s to 3.5s.
How about the Azure SQL?
While some suspect Azure SQL for cold-start delays, the database typically performs very well and is not the main culprit for slow cold starts. For example, inserting 10,000 records via a SQL script might take only 143 ms, whereas inserting them through X++ can average 10,000 ms—largely due to latency and transactional overhead on the AOS side, not the database itself.
So the conclusion is that it makes no sense to blame the SQL for cold start performance issues. The actual reason is the object loading and initiation of assemblies and .netmodules just takes time.
Word of advice
Reduce AOS restarts/deployments: Every AOS restart triggers the same loading and initialization of .netmodules and IL.
Test performance on a warm system: Always measure performance after the first load.
Implement a warm-up script: Access your most-used forms (SalesTable, PurchTable, CustTable, etc.) automatically on each AOS to reduce cold-start delays.
Avoid blaming Azure SQL: The real delay is in loading .netmodule files and initializing CoC/event handlers.
Adding more AOS instances may not help. Each AOS must still load and cache everything. As a result, more AOS instances could increase overall warm-up demands, and more users will be affected by the cold system syndrome.
References For official documentation on X++ and model architecture, consult Microsoft Learn: X++ Programming and other related Microsoft documentation.
Exciting news from Microsoft has just landed a new preview feature, and it’s all about making our Dynamics 365 environment cleaner, more efficient, and compliant.
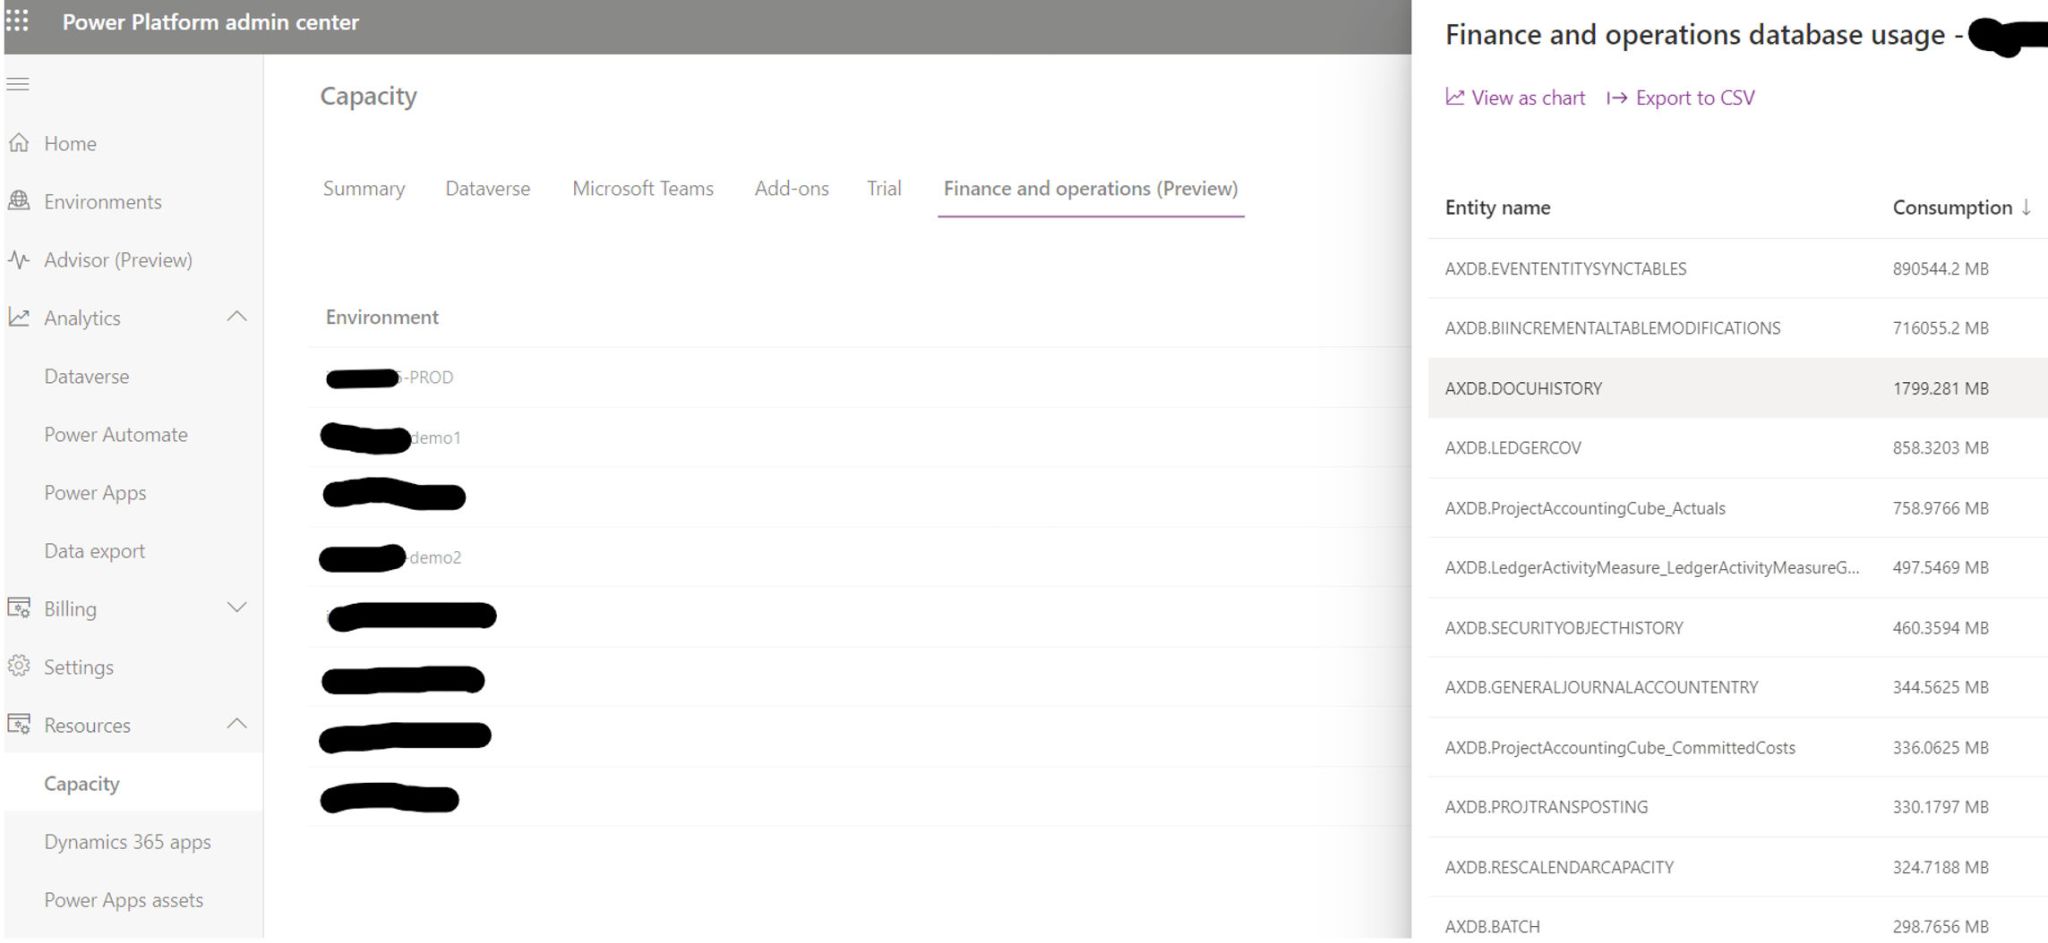
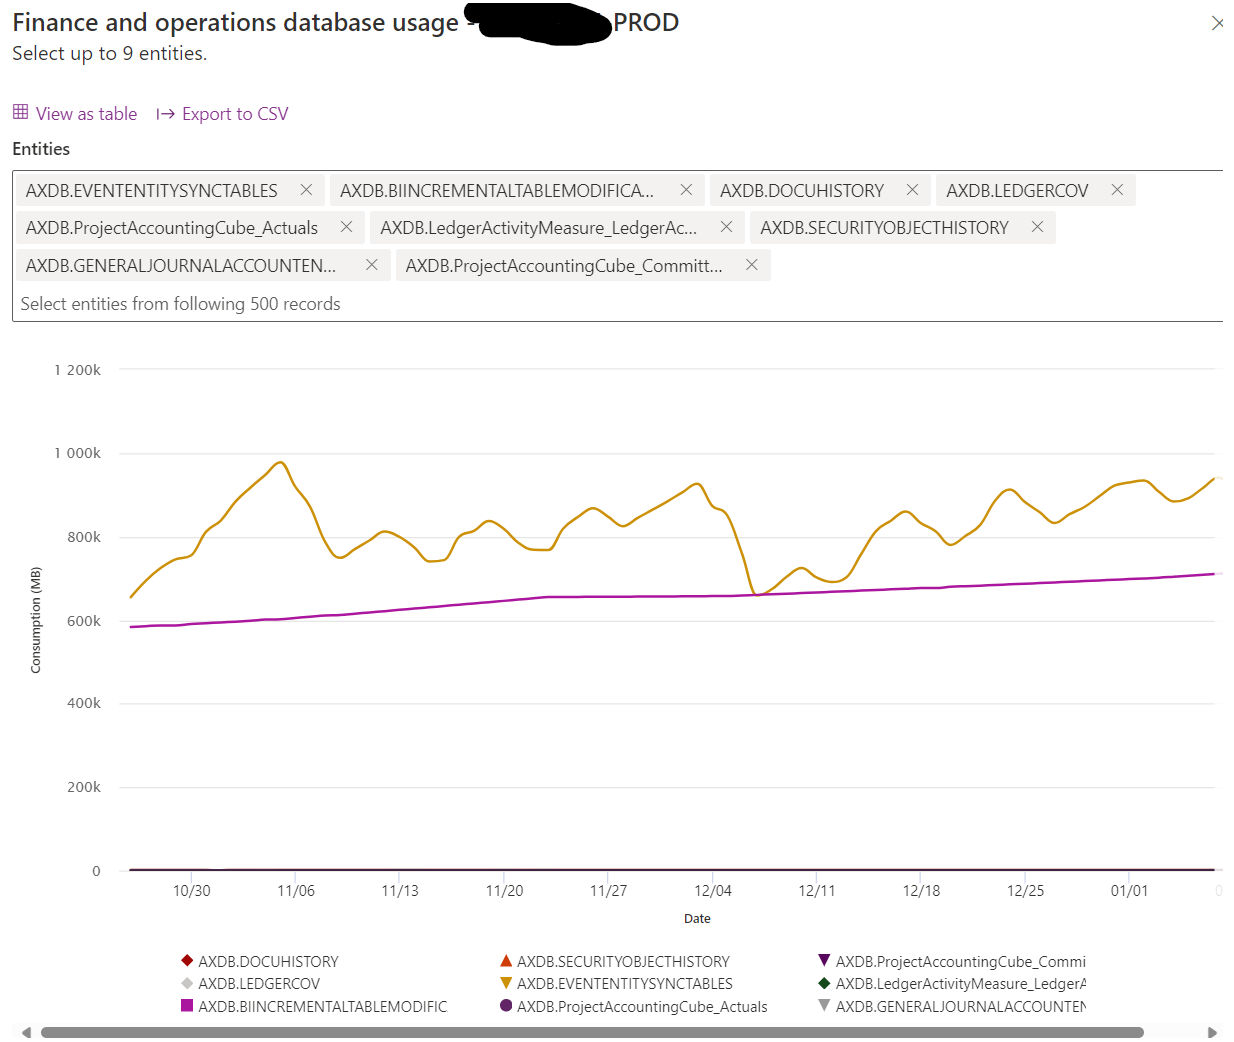
In a recent Yammer post, Microsoft announced a significant upgrade to the storage capacity experience in the Power Platform Admin Center (PPAC) for Finance and Operations. This new (preview) feature enables a deep dive into the storage consumption for each table within the Finance and Operations environment. Now, administrators can not only see the total storage used but also understand which tables are the heaviest. This level of detail was previously available only for Dataverse tables but is now extended to include Finance and Operations, bringing a new era of transparency and control.
Why is this Important?
1. Optimized Performance:
Data clutter is not just a storage issue; it can significantly impact the performance of your Dynamics 365 system. By identifying and cleaning up large, outdated, or unnecessary tables, you can streamline processes and improve overall system efficiency.
2. Cost-Effectiveness:
With the clear visibility of data storage, you can manage your resources better. Cleaning up unnecessary data can help stay within your storage capacity entitlements, avoiding additional costs.
3. Improved User Experience:
A well-maintained system with relevant, up-to-date information enhances the user experience. It makes data retrieval faster and more accurate, aiding decision-making processes.
How to Make the Most of This Feature?
Regular Audits: Schedule regular audits of your Dynamics 365 data. Use the new feature to identify high-storage tables and assess whether the data within is current and necessary.
Establish Data Cleanup Policies: Create policies for data retention and cleanup. Ensure these policies are in line with legal requirements and business needs.
Involve Stakeholders: Engage with various departments to understand the relevance of data. Sometimes, what seems redundant in one context is critical in another.
Leverage Automation: Consider automating the cleanup process where possible. For instance, set rules for archiving old records.
Monitor and Adapt: Post-cleanup, monitor the performance improvements and storage savings. Use these insights to adapt and refine your data management strategies.
And to understand how and what to clean up, then the following post is helpful :