I’ve been implementing D365 since it first became available. Over the years, the improvements have been both incremental in the short term and fundamental in the long run. Cloud, AI, and modern architecture have reshaped what’s possible.
But what puzzles me is this: the costs of implementing D365 and transforming business operations haven’t changed in any dramatic way. In short—it’s still as expensive as before. D365 projects remain a significant investment. I haven’t seen groundbreaking cost reductions nor revolutionary improvements in project timelines.
Is it the complexity of the businesses we serve that keeps costs high? Or is it the way we implement?
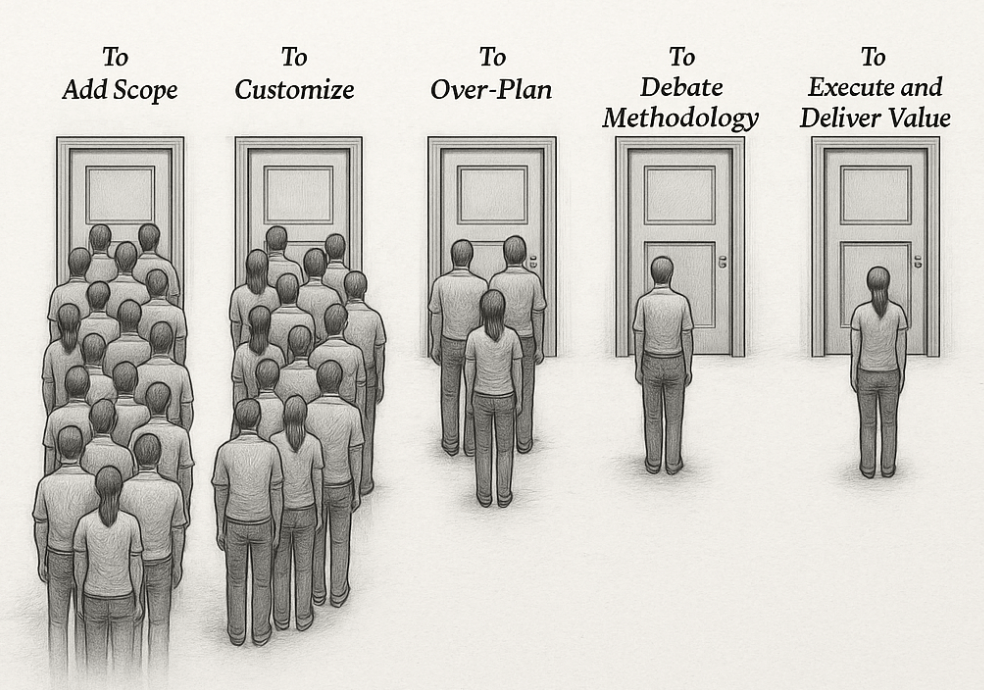
We now have more tools than ever before: preconfigured templates, industry accelerators, AI-assisted data migration, automated testing, low-code/no-code extensibility. But has any of this translated into faster, leaner projects? Or do these same tools just create space for more scope, more configuration, and more “what if we also…” discussions?
Maybe the real challenge isn’t the technology at all, but people. Business transformation has always been more about change management than software deployment. Even with better platforms, organizations still struggle to align processes, culture, and governance. Could these softer elements be the real bottleneck—and no technology ever deliver the cost reductions we expect?
Or is it us—the implementers? Do we hold on to project models that worked in the past instead of fully embracing new approaches? Are we overcomplicating, or simply responding to inherent complexity?
And perhaps there’s another angle: the way projects are guided from the top. Do managers at implementation partners truly understand the realities of modern D365 projects? Or are decisions sometimes made with outdated assumptions about effort, scope, and methodology? It’s a delicate question—but if the leadership guiding these projects hasn’t evolved as quickly as the technology, could that also explain why costs remain stubbornly high?
And what about the customers? Do they sometimes expect D365 to be a silver bullet, expanding scope beyond what’s realistic? Does the push for customization and perfection undermine the potential for a lean, standard-first approach?
If costs haven’t dropped, maybe the question shouldn’t stop at cost. Perhaps the value and revenues for companies implementing D365 have increased—making the same (or even higher) implementation spend worthwhile. Have organizations gained agility, sharper insights, or stronger customer engagement that offset the cost? If so, maybe the calculation has shifted from cost reduction to value creation. If not, then the cost question becomes even more urgent.
Looking back, I see remarkable progress in the platform itself. Yet when I look at implementation costs, I can’t shake the question: have we really moved forward in how we implement?
So the question remains: Have you actually seen D365 implementation costs go down—or is the real story in the value delivered?
Some facts to reflect on
Implementation still costs 2–5× license fees — $50K in licenses often means $150K–$250K first-year total (source).
Timelines haven’t collapsed — large D365 projects still average around 14 months (source).
Value is real — IDC found organizations gained an average of $20.6M in annual benefits after D365 implementations (source).
Chatty have helped with this post, but all content is mine.
The short answer is no! It is and will be too slow for a long time! But slow does not necessarily mean useless. We must set realistic expectations and create use cases where it is OK to be slow. I work a lot with performance enhancements and tuning Dynamics 365. I understand the underlying platform and architecture, how data is stored and fetched from Azure SQL and computed on. I see the latency and most importantly see the effect of tuning algorithms.
For “close-to-real time” scenario’s, AI/Copilot does not even come close to what we see in algorithmic performance. Let’s say you have an eCommerce site, or a POS. The user selects the products, and we need to present a price within a few milliseconds. Algorithms can do that. AI cannot. But AI solutions are excellent to build and adjust the business data and rules used for a pricing engine, when done in the background by AI agents.
This means that at the AI can set up and feed Dynamics 365 with the right data/setup to fulfill defined goals and scenarios. In the future I expect we can have AI Agents connected through MCP that monitor current sales data, cost changes, competitor pricing, and availability. We can have AI Agents that adjust and review current pricing and come up with recommendations on what to change. Price adjustments are then a logical business decision based on actual data to optimize revenues.
Today I see that the algorithmic performance is very fast, but the human reaction time/processes to adjust pricing and related data is slow. In the future pricing will be based on defined goals given to your Dynamics 365 agent. This agent will then perform analysis, run simulations, ensure approvals, monitor effect and adjust with optimalizations. But also communicate the price change effects to those responsible. The agents will enter the data into the forms and tables, making it ready to be used fast algorithmic applications.
We then get the best of two worlds; Fast algorithmic real time performance, mixed with the slow asynchronous AI that analyze and to all the heavy lifting to find better pricing and ensure better profitability.
So don’t fire your traditional developers yet. They are still needed to create lightning-fast real-time algorithms.
(This article was written without the use of any slow AI’s)
A SQL deadlock in Dynamics 365 occurs when two or more processes block each other by holding locks on resources the other processes need, causing a circular dependency that SQL Server cannot resolve without intervention. In the D365 context this typically arises during high-concurrency scenarios like batch jobs or heavy data imports where multiple threads compete for the same database rows or tables. The SQL engine resolves deadlocks by automatically terminating one of the conflicting transactions (the “victim”), which results in an error. In some situations, this also lead to DB fail and where sessions are moved to the secondary DB (That may not be scaled up as the primary DB)
So when experiencing sudden slowness and “strange” errors, please check in LCS for deadlocks like this, and start analyzing the call-stack.
One scenario I experienced when importing large sales orders in parallel, and where the sales orders have the same items. When having a lot of Commerce or EDI imports, it is common to place the entire sales order creation within the same transaction scope. Making sure that either is entire order is imported correct.
I would like to exemplify one specific instance that recently was identified together with Microsoft friends.
We experienced that frequently the D365 F&O started to be unstable and slow. And there where no clear indications of why. We could not repro. Customer reported sudden TTS errors, and that user get errors about losing connection to the DB. Typically, towards SysClientSessions.
Microsoft then carried out a deep analysis of telemetry, and the findings showed instances of frequent SQL failovers. Basically the DB failed, and the recovery mechanism moved the database sessions to fail-over DB clusters.
While going deeper, we found traces of deadlocks. It seems that DB architecture don’t like massive deadlocks, and when this happens, there are auto recovery mechanisms that kick-in to ensure up time and that users can continue to use the system.
In this specific instance the deadlock was caused by inserting a record table MCRPriceHistory, and the index RefRecIdIdx. This table is used for recording pricing details on the sales order. Finding deadlocks on insert are rare and a unicorn, and therefore I just had to write about is.
In this specific situation, there are two options :
1. Disable the Price History feature. (Unified pricing related), and wait for fix from Microsoft.
2. Create a support case to Microsoft, and ask for a index change on MCRPriceHistory, adding recid to the index RefRecIdIdx.
End note;
My main message to the community is to be aware of database deadlocks, as deadlock-escallation can have major impact on performance and may also trigger fail-safe mechanism in the Dynamics 365 architecture. And they are also very difficult to find and analyze. If you have deadlocks, please create a support case. I’m so grateful we as a partner have invested in Microsoft Premier Support, as this has been crucial to find root cause and final fix.
These notes show my personal learning and interpretations, and they are not official documentation from Microsoft. The goal is to offer a deeper look into how X++ code, the compiler, and the runtime work in Dynamics 365.
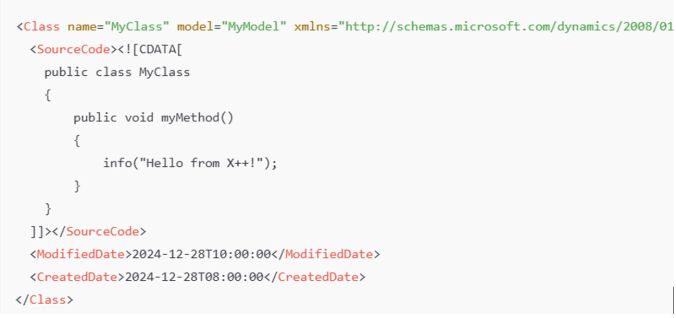
Where is the X++ code stored in the file system? X++ code resides in XML files that define classes, tables, forms, and other objects. These files are part of the application model’s metadata and appear in Visual Studio as X++ objects. Class Definition: Found as an XML file under \Classes\MyClass.xml.
Table Definition: Found as an XML file under \Tables\MyTable.xml, listing fields, methods, etc.
In a D365 10.0.42 codebase, the PackagesLocalDirectory contains approximately 542,091 files (about 17.69 GB). Of these, around 340,029 are XML files, representing the AOT (Application Object Tree).
What are the relationship between Models and Packages ? All code is placed into a model, which is essentially a design-time logical grouping of metadata and source files. You can see them on disk in a path like:
There are 171 models in the standard Microsoft codebase. Each model belongs to a package, which serves as the compilation and deployment unit. You can combine one or more packages into a deployable package for runtime.
Example The Application Suite model is the largest one, with 185,939 XML files, totaling 1.32 GB.
Compilation Output and .NET Components
Compiling X++ turns the application artifacts (X++ code, metadata, and resources) into deployable and executable components in .NET Intermediate Language (IL), which run under the CLR (Common Language Runtime). The compilation produces:
.dll files (the main assemblies)
.netmodule files (modules containing the IL code for X++ types)
.pdb files (debugging symbols, used primarily in development environments)
.md files (runtime metadata)
.netmodule files hold the actual IL code for each X++ type. If you open a form like SalesTable, all the required .netmodule files for that form must also be loaded.
.md files contain runtime metadata, classified by type (Class, Table, Form, etc.). They include only the essential metadata required at runtime (e.g., control hierarchies, table relationships), in contrast to the comprehensive XML files that exist only at design time. As a result, XML files are excluded when you deploy to sandbox or production.
.pdb files are for debugging and are not typically deployed to production.
How the Compilation Process Works
X++ code is first compiled into .netmodule files. The .netmodule files are then linked together to produce the final .dll file for the package. The .pdb file is generated alongside the .dll and holds debugging metadata.
The .netmodules also allows for incremental compilation, and you will thus often see multiple .netmodules files generated. But when you compile the entire smaller module, you will see that the .netModules are typically returned to one file. But for larger modules, like the Application Suite you can see that there are 276 .netmodules files. I suspect there are a limitation or optimalization to have the Application Suite splitted into multiple files.
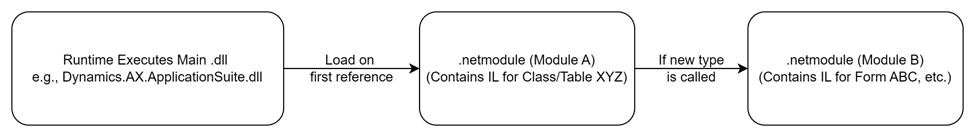
Runtime Execution and Loading Behavior When the system needs to run code:
The main .dll (e.g., Dynamics.AX.ApplicationSuite.dll) is loaded first.
The .netmodule files containing the needed X++ types (classes, forms, etc.) load on demand.
The runtime loads a specific .netmodule only when a type within it is first accessed. The first load includes overhead, such as initializing event handlers and chain-of-command (CoC). Subsequent calls to types in the same .netmodule do not incur the same cost.
How does this affect runtime behavior in relation to Cold vs. Warm Start
I guess most of us have experienced performance difference between cold and warm starts, and this is caused by runtime behaviors involving .netmodule files and object initialization.
At cold start:
When a class or object is accessed for the first time after an AOS restart, the runtime loads the .netmodule containing the class/object into memory. Static constructors and chain-of-command/event handlers are initialized and metadata required for the type is fetched and cached.
This initialization process can take significant time, especially for larger .netmodule files or types with complex dependencies.
To further explain, when opening the salesTable form can take up to 30s, as there are a lot of tables, classes, form elements that needs to be loaded also. And each of these may have extensions event handlers and chain-of-command. This results in an enormous amount of files to be accessed, loaded and initiated. In short, a domino effect of loading executable .netmodules happens. If you take a look at SalesTable, you realize the number of tables, extensions, modules and code that is packed together on a single form. I have not tried to understand or count the number of elements that go into loading this form, and here just showing number of extensions and tables you see in an extension of the Sales Table form.
During runtime, the system also builds and populates various caches (e.g., metadata, plugin, and event handler caches). Cache population may traverse large amounts of metadata, contributing to the cold-start delay.
At warm start:
After the .netmodule and associated handlers are loaded into memory, subsequent references to types in the same .netmodule are faster because the .netmodule is already in memory and metadata and handlers have been initialized. Opening the salesTable drops from 30s to 3.5s.
How about the Azure SQL?
While some suspect Azure SQL for cold-start delays, the database typically performs very well and is not the main culprit for slow cold starts. For example, inserting 10,000 records via a SQL script might take only 143 ms, whereas inserting them through X++ can average 10,000 ms—largely due to latency and transactional overhead on the AOS side, not the database itself.
So the conclusion is that it makes no sense to blame the SQL for cold start performance issues. The actual reason is the object loading and initiation of assemblies and .netmodules just takes time.
Word of advice
Reduce AOS restarts/deployments: Every AOS restart triggers the same loading and initialization of .netmodules and IL.
Test performance on a warm system: Always measure performance after the first load.
Implement a warm-up script: Access your most-used forms (SalesTable, PurchTable, CustTable, etc.) automatically on each AOS to reduce cold-start delays.
Avoid blaming Azure SQL: The real delay is in loading .netmodule files and initializing CoC/event handlers.
Adding more AOS instances may not help. Each AOS must still load and cache everything. As a result, more AOS instances could increase overall warm-up demands, and more users will be affected by the cold system syndrome.
References For official documentation on X++ and model architecture, consult Microsoft Learn: X++ Programming and other related Microsoft documentation.
Latest & greatest tech, faster, better and new possibilities, are from a consultancy perspective fun and rewarding. But it is very seldom that these aspects are the deciding factors when it come to implementing Dynamics 365. Any organization have a finite set of resources in terms of people, knowledge, money, and time. How to best utilize your resources can be difficult, but by building business case you have a process to evaluate your different options.
A business cases can be many things, but in this blog post I will focus on performing a business value review where Dynamics 365 benefits can be subjectively calculated on a high-level.
The end-result of a business value review would give some clear indications on:
1. Benefits – scaled and phased
2. Costs – scaled and phased
3. Key ROI measures; Payback, Net Present Value and Internal Rate Of Return
4. Cashflow through an implementation and onwards
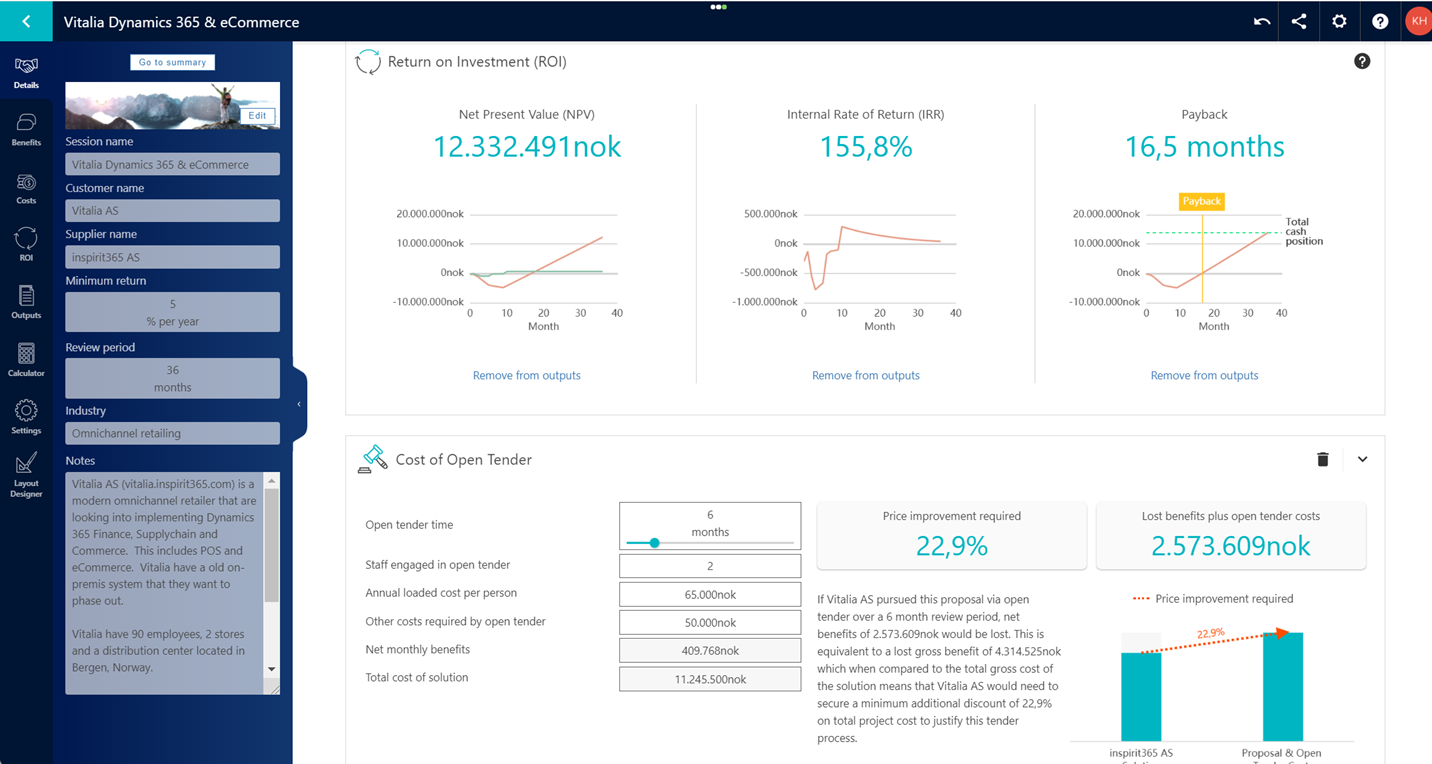
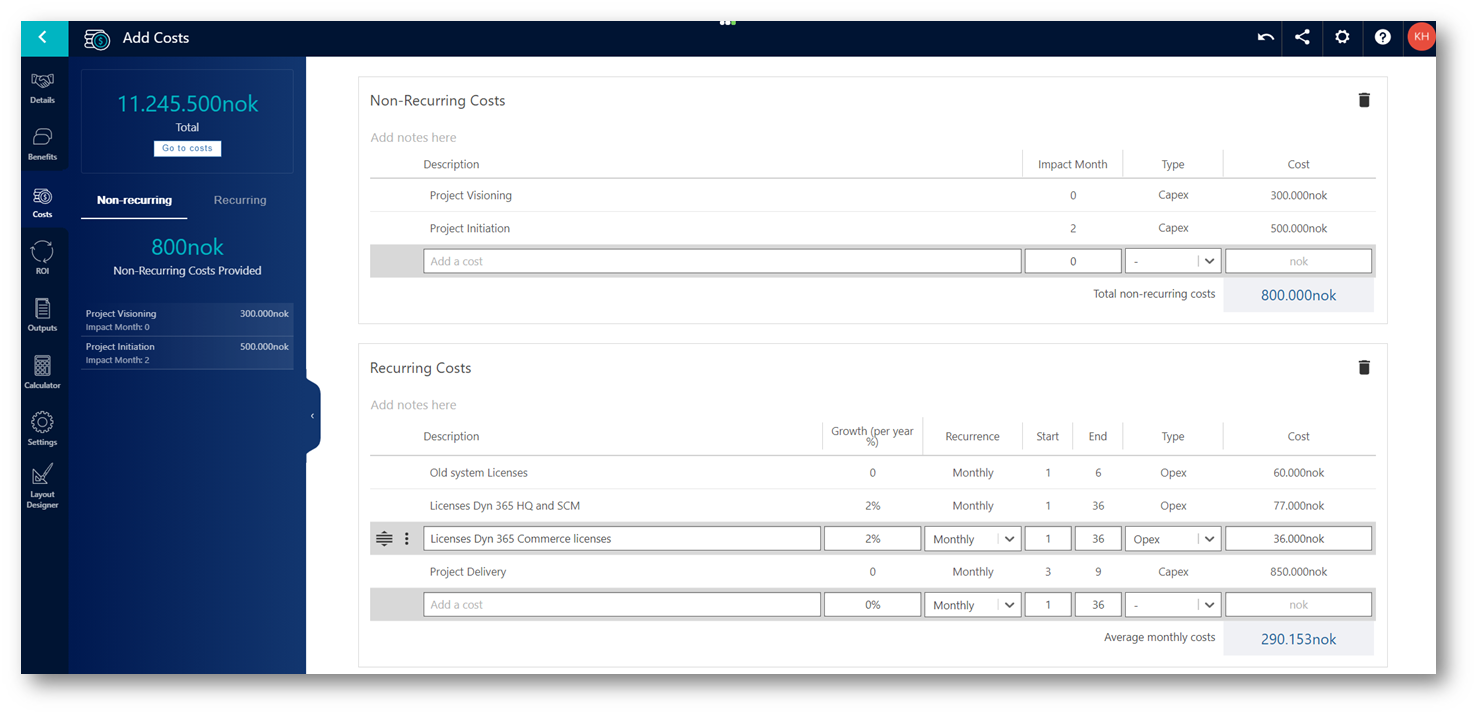
I’m used to quantify costs and benefits on a granular way to better see the value of a business case, and even to compare different business cases towards each other. The high-level end-result of a business case can be presented like this, where ROI are visualized, and as here shown that the payback time is 16,5 months.
“Net Present Value” is the current value of the benefit improvement after 36 months. Internal Rate of Return is the calculated return rate of the investment, and is relevant to compare against other investments (like building a new warehouse etc)
The cost of open tender visualizes the cost of delaying the implementation, and how much savings is needed to justify a delay and keeping an open tender process. Doing nothing also have a cost!
The cost picture of the business case can often be presented based on non-recurring costs and recurring costs per month.
The benefits can be built from predefined templates.
The benefits available for analysis can be divided into suites, and the following list is some of the benefits that may be relevant to calculate on.
General benefits
Benefit
Input values
Assumption
Revenue Gain
-Annual revenue ($)
-Increase in revenue (%)
-Gross margin (%)
For example, a D365 may increase cross and up-sell opportunities.
Reduce Revenue Leakage
-Annual revenue ($)
-Current revenue leakage (%)
-Revised revenue leakage (%)
Identifies areas where invoices (revenues) are raised for services that would otherwise have been missed. This is 100% margin as costs were incurred to provide the service in any case, e.g. chargeable telephone calls to customers
Margin Visibility Improvement
-Annual revenue ($)
-Current gross margin (%)
-Revised gross margin (%)
D365 gives visibility of order profitability that was not previously available. The orders can be dealt with on the basis of their profitability rather than passively dealing with every request that arrives.
Margin – Identify Chargeable Items
-Annual number of projects
-Average revenue per project ($)
-Increase in chargeable revenue by passing on costs to customers (%)
A D365 identifies areas where costs have been incurred and not passed to customers. These costs once passed to customers result in margin increase.
Cost Saving
-Current annual spend impacted by D365 ($)
-Reduction in spend (%)
The departmental spend will be reduced by D365.
Improve Cash Collection
-Annual revenue ($)
-Debtor days – today
-Debtor days – after
-Annual interest cost (%)
Improved business processes that generate electronic invoices will lead to faster, more accurate and more frequent delivery of invoices to clients – inevitably leading to faster invoice approval and payment.
Reduce Cash to Cash Cycle Time
-Current C2C cash requirements ($)
-Number of days between payment of accounts payable to collection of accounts receivable (C2C cycle time)
-Revised C2C cycle time (days)
-Annual interest cost (%)
Improved business processes will result in a reduction in the C2C cycle thus reducing liquidity requirements and freeing up cash.
Minimize Regulatory Costs
-Current annual regulatory costs ($)
-Revised annual regulatory costs ($)
The customer has obligations to report and that the cost of reporting can be significantly reduced by the proposed D365. Alternatively, non-compliance may lead to fines which could be reduced by better monitoring.
Labor Saving
-Number of direct staff currently engaged
-Direct efficiency improvement (%)
-Annual loaded cost per direct staff member ($)
-Number of indirect staff currently engaged
-Indirect efficiency improvement (%)
-Annual loaded cost per indirect staff member ($)
By making staff more efficient, a percentage of the staff can be re-deployed thus resulting in savings.
Improve Efficiency
-Annual total departmental/company spend ($)
-Efficiency improvement (%)
Avoid soft savings such as improving employee effectiveness. Look for hard savings that can improve efficiency in areas such as: Information availability – remote access to network data, real time access, single and structured storing of all customer/vendor/business data, wider access through portals, business analytics, strategic enterprise management and business planning, improved network intelligence and thus decisions. Integrated systems will allow better inter-departmental, inter-company and inter-organizational efficiencies.
Process Time Savings
-Time spent on manual processes (total FTE hours per month)
-Annual loaded cost per person ($)
-Efficiency improvement (%)
D365 automates and removes redundancy in manual steps such as information search, data integration etc. resulting in savings based on labor time.
Activity Time Savings
-Time spent on activity (total FTE hours per month)
-Annual loaded cost per person ($)
-Efficiency improvement (%)
-Annual non-labor costs ($)
-Reduction in non-labor costs (%)
D365 reduces the average time spent on a business activity leading to savings based on both labor time and other non-labor costs.
Waiting Time Avoided
-Current ‘dead’ waiting time per day (minutes)
-Revised ‘dead’ waiting time per day (minutes)
-Working hours per day per person
-Annual loaded cost per person ($)
-Number of people affected
The proposed D365 frees up a proportion of the current amount of wasted time.
Avoid Stationery Costs
-Current annual stationery spend ($)
-Reduction in stationery spend (%)
The current annual stationery spend is known and the new D365 leads to a reduction in that spend.
Cost Reduction – Rental Items
-Monthly rental costs ($)
-Percentage cost reduction (%)
Improved business processes and data visibility can lead to reduced purchasing spend through consolidation of existing contracts and improved access to information required for price negotiation.
Reduce Project Overrun Costs
-Annual costs of project overruns ($)
-Reduction in overrun costs (%)
D365 enables faster project delivery.
Improve Staff Effectiveness
-Number of staff engaged
-Current annual value per person ($)
-Improvement in effectiveness (%)
Staff generate value much greater than their loaded cost may imply and by making them more effective at their assigned task can lead to more value for the business.
Reduce Capital Costs
-Budgeted capital spend ($)
-Proportion of spend avoided (%)
-Life or write-down period of D365 (months)
-Interest/Minimum return rate (per year %) (%)
The customer rents the equipment instead of purchasing or receives a managed D365 which avoids capital spend.
Cost of Mistakes
-Current annual cost of mistakes ($)
-Reduction (%)
Improved systems can lead to better monitoring and control of all transactions and hence, better customer service and fewer mistakes leading to fewer penalties.
Litigation Avoided
-Average cost to employer per case ($)
-Number of cases avoided per year
To quantify the savings that could be made by avoiding incidents which lead to litigation. Better ADR (Alternative Dispute ReD365) procedures can shorten time and therefore cost in litigation.
Assumptions that improved safety will lead to fewer accidents.
Penalty Avoidance
-Current annual penalty value ($)
-Reduction (%)
Lower penalties or fines imposed by regulatory bodies result from improved tracking of information.
Reduce Professional Services Costs
-Annual spend on professional services ($)
-Reduction (%)
Improved business process, data visibility, recording, retrieval and management lead to reduced requirement for professional services.
Reduce Marketing Costs
-Current annual marketing spend ($)
-Reduction in marketing spend (%)
The current annual marketing spend is known and more accurate marketing leads to a reduction in that spend.
Protect Brand Value / Reputation
-Annual value vulnerable to loss ($)
-Proportion of this value now protected by D365 (%)
Although brand is probably not valued directly on the balance sheet, the customer can use a percentage of the revenue to give a value. The new D365 protects the brand and inherent value by ensuring that legal and Corporate Social Responsibility (CSR) requirements are met.
Retail and Consumer Goods benefits
Benefit
Input values
Assumption
Competitive Advantage – Extra Revenue
-Annual revenue ($)
-Percentage increase in revenue (%)
-Gross margin (%)
Improved access to and use of customer information will lead to an overall increase in revenue.
Sale Value per Transaction – Increase
-Number of sales transactions per year
-Current average value per transaction ($)
-Increase in value (%)
-Gross margin (%)
The D365 helps the user increase their value of sales transaction through pricing, recommendations, AI/ML and omnichannel.
Inventory – Weeks of Supply
-Annual Revenue ($)
-Gross margin (%)
-Current value of inventory ($)
-Revised weeks of supply
-Annual interest cost (%)
The D365 gives rise to better monitoring and handling of inventory transactions thus reducing the weeks of supply required.
Shrinkage Reduction
-Annual revenue ($)
-Gross margin (%)
-Current shrinkage (%)
-Revised shrinkage (%)
Improved business processes give rise to better monitoring and handling of inventory transactions thus reducing the amount of shrinkage.
Improved Campaign Success
-Number of campaigns per year
-Average revenue generated by campaign ($)
-Improvement (increase in number or success rate) (%)
-Gross margin (%)
Improved customer data availability will lead to better targeted campaigns and potentially additional ones within the existing budget leading to improved revenue.
Mark Down Reduction
-Annual revenue (sales) ($)
-Annual value of mark downs ($)
-Revised marked down sales as percentage of annual sales (%)
-Margin on marked down sales (%)
-Average gross margin (%)
To quantify the additional revenue/margin that could be generated by being able to reduce the number of goods that are marked down during a sales season.
The D365 enables the user to identify and minimize the amount of mark downs
Mark Up Improvement
-Annual revenue (sales) ($)
-Annual value of mark ups ($)
-Revised marked up sales as percentage of annual sales (%)
-Margin on marked up sales (%)
-Average gross margin (%)
To quantify the additional revenue/margin that could be generated by being able to increase the number of goods that are marked up during a sales season.
The D365 enables the user to identify and maximize the amount of mark ups.
Sales per sq m – Increase
-Annual revenue ($)
-Sales space (sq m)
-Increase post implementation (%)
-Gross margin (%)
To quantify the extra margin that can be made by increasing the value of sales per m2 i.e. unit area of sales space.
The D365 helps the user to maximize their value of sales per unit area of sales space.
Reduce Inventory Holding
-Current value of inventory ($)
-Percentage reduction in inventory holding (%)
-Annual interest cost (%)
Improved business processes can lead to better monitoring and handling of inventory transactions. Reducing the inventory could be brought about by improved vendor relations, supplier reviews, supplier self-service and price/quantity negotiations with suppliers based on data visibility and history. A more efficient, integrated system that looks at the whole business will inevitably allow greater control over re-ordering. Improved data visibility will lead to optimal inventory holding.
Maverick Buying Reduction
-Current annual procurement value ($)
-Percentage of procurement that is uncontrolled (%)
-Uncontrolled percentage in D365 (%)
-Percentage by which controlled buying is cheaper (%)
To quantify the savings in purchasing costs as a result of better control over buying activity leading to reduced maverick or ‘rogue’ purchasing.
Improved business processes and data visibility can lead to reduced purchasing spend through consolidation of existing contracts and improved access to information required for price negotiation.
Better Procurement Margins
Current annual procurement value ($)
-Price improvement (%)
Improved business processes and data visibility can lead to reduced purchasing spend through consolidation of existing contracts and improved access to information required for price negotiation.
Reduce Haulage Costs
-Annual spend on haulage ($)
-Reduction (%)
Better information about route planning, loading, and/or capacity planning allows savings from delivery efficiencies, or savings from consolidation of costs to external suppliers or different shipment methods.
Reduce Track and Trace Costs
-Current annual spend on track and trace ($)
-Reduction in spend (%)
The customer has obligations to know, and supply on demand, the exact production details of a product or batch of products and that the cost of this process can be significantly reduced by the proposed D365. Alternatively, non-compliance may lead to fines which could be reduced by better monitoring
Avoid Penalties, Returns, Credit Memos
-Current monthly value of returns or credit memos ($)
-Reduction (%)
To quantify the savings that can be made by avoiding late delivery penalties or by reducing avoidable errors that lead to returns and/or credit memos. Many of these are penalties brought about by inadequate customer service. Improved business processes can lead to better monitoring and control of all transactions and hence, better customer service and fewer penalties.
Improve Revenue per Customer
-Current number of customers
-Average revenue per customer per month ($)
-Increase in revenue (%)
-Gross margin (%)
To quantify the additional monthly revenue per customer that would be generated by implementing D365. Extra revenue is generated because D365 allows additional services or products to be sold to the existing customer base. The increased revenue may be as a result of cross-selling or up-selling.
Reduce Inventory Lead Times
-Current value of inventory ($)
-Average lead time (calendar days)
-Revised lead time (calendar days)
-Annual interest cost (%)
Improved business processes give rise to better monitoring and handling of inventory transactions thus reducing the lead times. Since inventory ties up working capital, a saving of a few days can result in significant savings. The new lead times could be brought about by improved vendor relations, supplier reviews, supplier self-service and price/quantity negotiations with suppliers based on data visibility and history. An integrated system that looks at the whole business will inevitably allow greater control over inventory re-ordering.
Increase Number of Customers
-Annual revenue ($)
-Current number of customers
-Current number of customers acquired per year
-Annual percentage improvement (%)
-Gross margin (%)
To quantify the additional monthly revenue and associated margin that would be generated if the proposed D365 helps acquire more customers. Each new customer brings extra revenue and associated margin. The number of customers increases year on year.
Customer relationship management benefits
Benefit
Input values
Assumption
Competitive Advantage – Extra Revenue
-Annual revenue ($)
-Percentage increase in revenue (%)
-Gross margin (%)
Improved access to and use of customer information will lead to an overall increase in revenue.
Increase Customer Satisfaction
-Annual revenue ($)
-Percentage improvement from D365 (%)
-Gross margin (%)
D365 leads to an improvement in customer satisfaction that in turn leads to improved revenue
Increase Order Value
-Average order value ($)
-Annual number of orders
-Increase in order value with D365 (%)
-Gross margin (%)
Extra revenue is generated because D365 allows resources to be concentrated on customer facing activities for a greater proportion of time available. The D365 also provides faster access to information which may be used to improve sales effectiveness (price changes, new products, product queries, inventory queries etc.) and cross-selling or up-selling initiatives. The result may be measured in an increased average order value.
Improve Customer Retention
-Annual revenue ($)
-Current number of customers
-Current annual retention rate (%)
-Target annual retention rate (%)
-Gross margin (%)
Improved business processes can lead to better monitoring and control of all transactions and hence, better customer service and happier customers. Improving the customer retention impacts the annual turnover and therefore increases the revenue year on year.
Customer Acquisition Cost Saving
-Number of new customers acquired each year
-Current cost of acquisition ($)
-New cost of acquisition with D365 ($)
The current acquisition cost is known and a reduction will result from improved data availability and more efficient business practices.
Re-engage Customers
-Number of lapsed customers contacted
-Estimated conversion rate (%)
-Average annual revenue per customer ($)
-Gross margin (%)
Lapsed customers are easier to re-convert than to find new customers hence contacting them should result in a high conversion rate. Experience shows that lapsed customers can be your hottest prospects.
Improve Bid Win Rate
-Number of bids per year
-Average bid size ($)
-Current bid success rate (%)
-Revised bid success rate (%)
-Gross margin (%)
Improved information provided by the D365 increases the quality of bid responses, leading to higher conversion rates
Increase Customer Self-Service
-Annual number of transactions
-Percentage of total that could be self-served (%)
-Current average cost per transaction (not self-serve) ($)
-Average cost for self-service ($)
-Percentage of possible transactions that could be encouraged to self-serve (%)
There is a defined cost for serving customer transactions which is greater than the cost that would be incurred if the transactions could be self-served. The D365 will move a proportion of transactions to the self-serve option.
Business Intelligence benefits
Benefit
Input values
Assumption
Improved Campaign Success
-Number of campaigns per year
-Average revenue generated by campaign ($)
-Improvement (increase in number or success rate) (%)
-Gross margin (%)
Improved customer data availability will lead to better targeted campaigns and potentially additional ones within the existing budget leading to improved revenue.
Analytics Savings
-Time spent on analytics (total FTE hours per month)
-Annual loaded cost per person ($)
-Analytics efficiency improvement (%)
-Annual non-labor analytics costs ($)
-Reduction in non-labor costs (%)
D365 reduces the average time spent on data preparation for analytics resulting in savings based on both labor time and other non-labor costs.
Model Deployment Savings
-Annual number of models
-Average time taken per deployment (working days)
-Annual loaded cost per person ($)
-Reduction in deployment time (%)
-Annual non-labor cost per model deployment ($)
-Reduction in non-labor costs (%)
D365 reduces the average time to create and deploy models resulting in savings based on labor time and other non-labor costs
Reporting Savings
-Time spent reporting (total FTE hours per month)
-Annual loaded cost per person ($)
-Reporting efficiency improvement with D365 (%)
-Annual non-labor reporting costs ($)
-Reduction in non-labor costs (%)
D365 reduces the average time spent on data preparation for reporting resulting in savings based on both labor time and other non-labor costs
Data Quality Savings
-Time spent on data quality (total FTE hours per month)
-Annual loaded cost per person ($)
-Data quality efficiency improvement (%)
-Annual non-labor data quality costs ($)
-Reduction in non-labor costs (%)
D365 reduces the average time spent on data quality assurance resulting in savings based on both labor time and other non-labor costs.
Consulting Cost Savings
-Current annual spend on consultancy or other 3rd parties ($)
-Percentage reduction in spend (%)
D365 can help optimize consulting costs and may be able to eliminate them.
Improved Legacy System Access
-IT time spent accessing legacy systems (total FTE hours per day)
-Annual loaded cost per person ($)
-Improvement in legacy system access (%)
-Annual non-labor cost of legacy systems access ($)
-Reduction in non-labor costs (%)
D365 enables significantly faster access procedures which frees up IT time. Depending on the use of the data accessed the speed improvement can lead to more timely / accurate business decision making.
Fraud Reduction
-Current annual fraud – missed revenues or refunds ($)
-Current rate of fraud detection (%)
-Rate of detection with D365 (%)
The D365 fraud protection can detect and therefore eliminate the fraud up to a maximum of 100 percentage of the current level.
Earlier Fraud Detection
-Total value of annual fraud recovery ($)
-Current average age of claims to be recovered (months)
-Revised average age of claims (months)
-Annual interest cost (%)
The D365 fraud protection will allow the detection of fraudulent claims and will allow the business to take action sooner thus speeding up the recovery process.
Workforce Optimization
-Total number of staff-Annual staff turnover (churn) % (%)-Annual loaded cost per person ($)
-Revised annual loaded cost per person ($)
The assumption that the staff that are lost throughout the year can be replaced by lower cost staff. Some D365s use familiar menus and structures which mean lower cost staff can be employed.
Reduce Skills Duplication
-Number of staff currently engaged
-Efficiency improvement (%)
-Annual loaded cost per person ($)
D365 reduces the number of duplicated activities, and a percentage of the staff can be re-deployed thus resulting in savings.
Better Forecasting – Control Inventory
-Current value of inventory ($)
-Percentage reduction with improved forecasting (%)
-Annual interest cost (%)
Improved customer information leads to improved forecasting which will allow better planning for inventory requirements. Not only will more inventory outages be avoided, but the amount of working capital reduced through the need for lower buffer inventory.
Better Forecasting – Liquidity
-Current capital requirements ($)
-Reduction in capital requirements with D365 (%)
-Annual interest cost (%)
Improved business processes will result in a reduction in the liquidity requirements thus freeing up cash.
Avoid Non-competitive Propositions
-Annual Revenue ($)
-Current gross margin (%)
-Revised gross margin (%)
D365 gives visibility of order profitability that was not previously available. The orders can be dealt with on the basis of their profitability rather than passively dealing with every request that arrives.
Earlier / Faster Responses to Losses
-Monthly losses that may be avoided ($)
-Current time before losses can be avoided (calendar days)
D365 enables faster identification of impending losses that may be avoided.
Appropriate Customer Servicing Cost
-Total number of customers
-% paying for and receiving ‘Gold’ service (%)
-Percentage of remainder incorrectly receiving ‘Gold’ service (%)
-Annual cost to serve ‘Gold’ customer ($)
-Annual cost to serve standard customer ($)
There is a defined cost for serving those customers at the higher level services and it is higher than that for standard level service. D365 will ensure that those that have paid actually receive the appropriate level of service. The savings come from ensuring customers who have paid for the standard service do not incorrectly receive the higher, more costly service.
First Time ReD365 – Escalations Savings
-Number of escalations managed per month
-Total FTE time to manage an escalation (hours)
-Annual loaded cost per person ($)
-Other non-labor costs per escalation ($)
-Reduction in escalations (%)
The quantity of escalations can be reduced by ensuring calls are resolved first time round. This can be achieved by ensuring all agents have access to a 360degree view of customer. Making sure you have the right skills, with right equipment and parts the first time, reduces escalations.
Staffing Demand Forecasting
-Number of permanent staff required to cope with peaks of demand
-Percentage of permanent staff replaced by temps to cope with peaks (%)
-Annual loaded cost per person ($)
-% premium paid for temporary staff (%)
-Percentage of time when temporary staff required (%)
Assumption that a percentage of the staff that is affected by the proposed D365 can be re-deployed.
IS/IT related benefits
Benefit
Input values
Assumption
Technology Refresh Avoided
-Cost of planned technology refresh that will be avoided ($)
-Cost of the technology evaluation & research needed in preparation for technology refresh ($)
-Cost of training staff to operate the new technology ($)
-Cost of implementation of the new technology ($)
-How long until refresh due (months)
Every 3 to 5 years (36 to 60 months), new technology arrives which replaces current systems. With D365, it is possible to avoid spend on new technology
IT Maintenance Cost Reduction
-Current annual support spend ($)
-Revised annual support spend ($)
Improved business processes will result in a reduction in the costs incurred in supporting them. This is brought about by improved efficiency, resilience, reduced numbers of discrete functions etc.
HW & OS Support Savings
-Current annual support spend ($)
-Proportion of support spend saved (%)
Managed services result in a reduction in the costs incurred in supporting equipment. This is brought about by improved efficiency, resilience, reduced numbers of discrete functions etc. A general rule of thumb is that maintenance costs represent 80 % of the overall costs of an application throughout its life. A single data repository, improved impact analysis capabilities and drag and drop design interface could reduce integration maintenance time and costs by a factor of 2 or 3
Asset Management Cost Reduction
-Value of assets under management ($)
-Assets not re-purchased annually (%)
-People required to manage assets
-Annual loaded cost per person ($)
-Management effort reduction (%)
Improved business processes can lead to better monitoring and control of assets. As a consequence, assets are not duplicated and there is a reduction in management effort.
Avoid Software License Costs
– Current annual license costs ($)-Reduction (%)
Licensing costs for the existing D365s are known and a proportion of those licenses are made redundant by the new D365.
Contractor Costs Reduction
-Number of contractors / temporary staff engaged
-Number of days worked per year per contractor
-Daily rate per completed working day ($)
-Reduction with D365 (%)
Contractors are required for many reasons including supporting legacy systems. Their activity may not be needed with the proposed D365.
Help Desk Savings
-Number of help desk calls handled per month
-Average time spent per call (minutes)
-Annual loaded cost per person ($)
-Non-labor cost per call of help desk services ($)
-Percentage reduction in calls (%)
D365 may significantly reduce the calls coming in to help desks by avoiding calls to retrieve old revisions of documents.
Reduce Trouble Ticket Volume
-Annual number of trouble tickets
-Cost per trouble ticket ($)
-Reduction in trouble tickets (%)
Assumptions that the number of trouble tickets can be reduced following the implementation of D365.
Time Savings – IT User
-Total number of IT users
-Waiting time per user (minutes per day)
-Annual loaded cost per person ($)
-Percentage waiting time saved (%)
D365 frees up users’ wasted time
IT Staff Savings
-Number of ICT staff currently engaged
-Efficiency improvement (%)
-Annual average loaded cost per person ($)
Assumptions that a percentage of the staff that are affected by the proposed D365 can be re-deployed to other tasks
Outage Reduction – SLA Improvement
-Outage cost per hour
-Current uptime (or SLA) (%)
-Revised uptime (or SLA) (%)
The outage cost is known and the SLA offered is better than the existing one. It is assumed that the service is provided for 24 hours per day and 365 days per year i.e. 8,760 hours per year.
Reduce Downtime Costs
-Current downtime per month (hours)
-Downtime cost per hour ($)
-Reduction in downtime (%)
Improved business processes will result in faster more secure recovery of data in the event of a loss of system or the absence of a key person thus reducing downtime.
Servers Saved
-Number of servers used for business processes
-Proportion saved/avoided with D365 (%)
-Annual external charges per server (3rd party etc.) ($)
-Annual internal charges per server (allocation) ($)
The proposed D365 uses existing servers more efficiently making a proportion of new server purchases unnecessary or re-deployable to other areas of the business. The monthly 3rd party and / or annual internal cost of maintaining the infrastructure is thus saved.
Datacenter Power Efficiencies
-Total installed equipment power rating (kW)
-Current datacenter power usage effectiveness (PUE)
-Alternative datacenter PUE
-Cost per kWh ($)
-Carbon cost per ton ($)
Cloud services can reduce energy consumption and CO2 production.
Energy and Cooling Savings
-Cost per kWh ($)
-Present consumption (kWh per month)
-Percentage saving (%)
D365 requires less hardware and therefore leads to reduced energy consumption and running costs.
Update / Patch Deployment Savings
-Number of update and/or patch deployments per year
-Current time taken for each deployment (hours)
-Annual loaded cost per person ($)
-Revised time taken for each deployment (hours)
Deployments are performed multiple times throughout the year
Faster Application Deployment
-Number of application deployments per year
-Current time taken for each deployment (hours)
-Annual loaded cost per person ($)
-Revised time taken for each deployment (hours)
Deployments can be performed faster on a cloud D365.
Internal Development Costs Avoided
-Annual cost of developing D365 internally ($)
-Reduction in development costs (%)
The customer is considering developing a D365 internally. Costs such as manpower, tools etc. can be avoided with the proposed D365
Reduce Application Integration Costs
-Annual spend on application integration (internal) ($)
-Reduction in internal application integration spend (%)
-Annual spend on application integration (outsourced) ($)
-Reduction in outsourced application integration spend (%)
-Other annual costs avoided (e.g. testing) ($)
D365 has the capability to integrate with other systems. This can reduce the need for expensive IT resource to integrate applications. The task can be done instead by a business administrator.
Avoid Systems Integration Costs
-Annual spend on Systems Integration ($)-Reduction (%)
Current SI costs are known and a proportion of those are made avoided by the proposed D365.
Disaster Recovery Savings
-Time spent on DR capability maintenance (total hours per month for all staff)
-Annual loaded cost per person ($)
-Time saving (%)
-Annual non-labor DR costs ($)
-Reduction in non-labor costs (%)
D365 reduces the average time spent on DR resulting in savings based on both labor time and other non-labor costs.