I keep seeing the same pattern repeat itself across customers: “We have Fabric now, so let’s just replicate everything from Dynamics 365 into OneLake.” And then a few months later the same customer is surprised by three things at once. First, the cost curve. Second, the complexity curve. Third, the uncomfortable realization that they have started rebuilding parts of Dynamics 365… outside Dynamics 365.
Fabric is strategic. I am not arguing that. Microsoft is very explicit that OneLake is meant to be the “single place” for analytics data, available across multiple engines. The problem is not Fabric. The problem is what we choose to do with it, and how quickly we forget why an ERP exists in the first place.
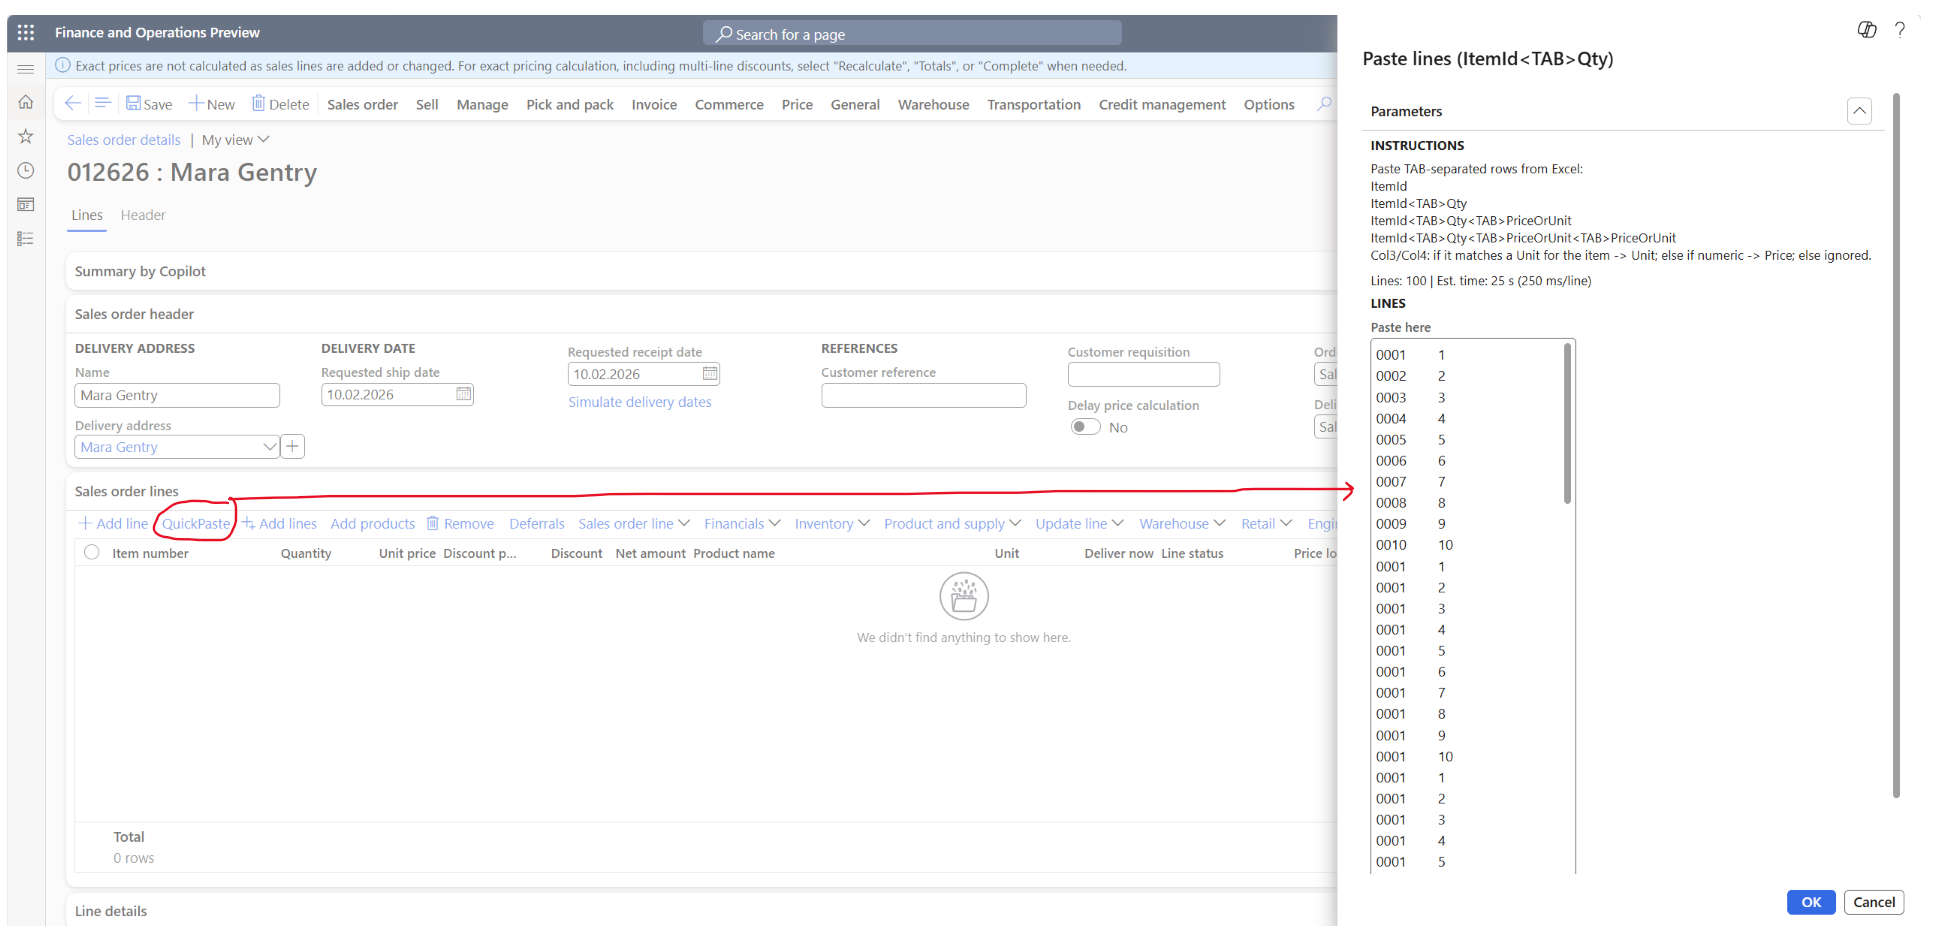
If you want a concrete visual: look at a typical Synapse Link setup where customers have enabled the “usual suspects” from F&O. Inventory transactions, warehouse work, tax transactions, journal lines, pricing history. Some of these tables are not “big”. They are massive. When you see row counts that look like they belong to a data warehouse already, it is not a badge of honor. It is a warning sign. Because those rows are not free when you move them, store them, curate them, query them, secure them, and refresh semantic models on top of them. You pay multiple times, in multiple places, often without noticing until the bill arrives.
There is also a subtle mindset shift that happens when a team gets access to a powerful analytics platform. The conversation moves from “what insights do we need?” to “what can we replicate?” That is a dangerous shift. The right unit of design is not “tables”. The right unit of design is “decisions”. What decision are you trying to support, and what level of freshness and accuracy does that decision require? If the answer is “we’re not sure yet, but we might need it later”, that is how you end up with a lake full of data and a drought of clarity.
Dynamics 365 F&O is an operational system built around process integrity. Posting is posting. Inventory settlement is inventory settlement. Tax calculation is tax calculation. Those aren’t just numbers; they are outcomes of business logic, security boundaries, and transactional consistency. When you replicate the raw ingredients into Fabric and recreate the outputs externally, you are betting that you can reproduce the ERP’s behavior correctly over time. Not once, but continuously. Across updates. Across configuration changes. Across new legal requirements. Across new features. Across edge cases you don’t even know exist yet.
In other words: you are signing up for logic drift.
And logic drift in finance is not “a small defect”. It is the kind of defect that shows up when the CFO asks why the numbers don’t match, when the auditors ask where the number came from, or when someone has to reverse-engineer an external pipeline that a consultant built two years ago and no one dares to touch anymore.
This is the part I think we need to be more honest about: pushing data into Fabric is easy. Maintaining truth outside the ERP is not.
Cost is where this becomes impossible to ignore. Fabric has a capacity model, and OneLake storage has its own billing rules and thresholds. If you replicate high-churn operational tables and then run transformations and aggregations on them in Spark, SQL endpoints, semantic models, and scheduled pipelines, you create continuous consumption. You pay for ingestion, you pay for compute, you pay for refresh, and you pay for people babysitting it. Often the justification is “self-service BI”, but the end state is rarely self-service. It becomes a parallel delivery organization: one team maintaining ERP logic, another team maintaining “ERP logic, but in Fabric”.
Then we add the next multiplier: external reporting that gets recreated because it “feels easier” to do it outside. And yes, it is often easier in the short run. Until you realize you recreated not only reports, but controls. You recreated security rules. You recreated data classifications. You recreated audit trails. You recreated process understanding. You created a second nervous system for the company.
That is not modernization. That is duplication.
Security and governance are often treated as a checkbox in these projects. “We’ll just lock down the lake.” But the whole point of an ERP security model is that it is deeply tied to the business model: legal entities, duties, privileges, segregation of duties, sensitive fields, posting permissions, and all the nasty details we don’t like to talk about until something goes wrong. When you export to a lake, you export beyond the ERP’s runtime enforcement boundary. Now you need equivalent controls in Fabric/OneLake and in every downstream consumer. The attack surface increases because there are simply more places where data exists, and more places where it can be mishandled. This is not theoretical. It is how leaks happen in the real world: not through one catastrophic hack, but through “we copied it here as well” and nobody updated the governance after the copy.
This is where Synapse Link becomes relevant. It is a solid concept: continuously export and maintain data in a lake, including support for Delta Lake format which is described as the native format for Fabric. For F&O specifically, Microsoft’s documentation is clear that you can select F&O tables and continuously export them, and that finance and operations tables are saved in delta parquet format. This is powerful. It is also exactly why you should be careful. Power without discipline turns into sprawl.
Is Synapse Link the new noisy neighbor?
Microsoft does not position Synapse Link as “this will slow down your ERP”. The design intent is that it should be safe. But intent is not the same as operational reality under extreme volume, extreme churn, and poor selection discipline. Synapse Link exports incremental changes in time-stamped folders based on configured intervals, and it is explicitly designed for continuously changing data. That means the export machinery is continuously active, and the more you include, the more work it has to do. If you include the highest-churn, highest-volume tables in your environment and you run this alongside peak operational hours, you should at least ask the question: what is the impact on the core system?
The most honest answer today is that you cannot just assume “no impact”. You need to measure. You need telemetry, correlation with peaks, and a willingness to reduce scope if the data product is not worth the operational pressure. And you should be especially skeptical in scenarios where InventTrans-like tables are involved, where “delta churn” is effectively the business. If your warehouse runs all day, your data changes all day.
There is also a hidden tax on the lake side. Exporting data is only the first step. Most customers don’t want raw operational tables in their semantic layer. They want curated facts, conformed dimensions, and business definitions. That curation takes compute. Fabric even publishes performance and ingestion guidance for its warehouse and SQL analytics endpoints, which is a polite way of saying: you can absolutely build something slow and expensive if you do not design it well. If your “strategy” is to copy everything first and then figure out the model later, you will pay for that strategy every day.
So where do we draw the line?
The line is not “Fabric vs D365”. The line is “analytics vs operations” and “insight vs process”.
If the goal is enterprise analytics, cross-domain reporting, AI enrichment, or long-term historical trends, Fabric is the right place to build. That is exactly what it is for. But the data that lands there should be deliberate. Curated. Purpose-driven. If you do not know why you need a table, that is not a good enough reason to export it “just in case”.
If the goal is operational execution, financial truth, posting behavior, compliance logic, and business process control, Dynamics 365 should remain the authority. Not because Fabric cannot calculate things, but because the ERP is the contract. It is where rules live, where approvals live, where the audit trail starts, and where the business can point and say: this is the official outcome of a process.
And if your reporting requirement is truly operational—“what is happening right now and what should I do about it?”—you should challenge the reflex to build it externally. Operational reporting often belongs close to the process, not one pipeline away from it.
The real danger is not that customers adopt Fabric. The danger is that customers externalize their critical business logic under the banner of “data platform modernization”, and only later discover that they have created a more expensive, less governed, more fragile version of their own ERP.
So no, everything does not have to be in Fabric in 2026.
Fabric should be where you build data products that create leverage: cross-domain insight, scalable analytics, AI-driven forecasting, and enterprise semantics. Dynamics 365 should be where you execute the business with integrity. The most mature architectures I see are not the ones that export the most tables. They are the ones that can explain, with a straight face, why each exported dataset exists, who consumes it, what decision it supports, what it costs, and what happens if it is wrong.
If you want to cause reflection in your organization or with your customers, ask one question in every Fabric replication discussion: are we building insight, or are we rebuilding Dynamics?
Because those are two very different projects, and only one of them usually ends well.