In the first “ping” test blog post, we tested the response time of the SQL. This time we will use the “performance test” feature to test the AOS/Web Server response time.
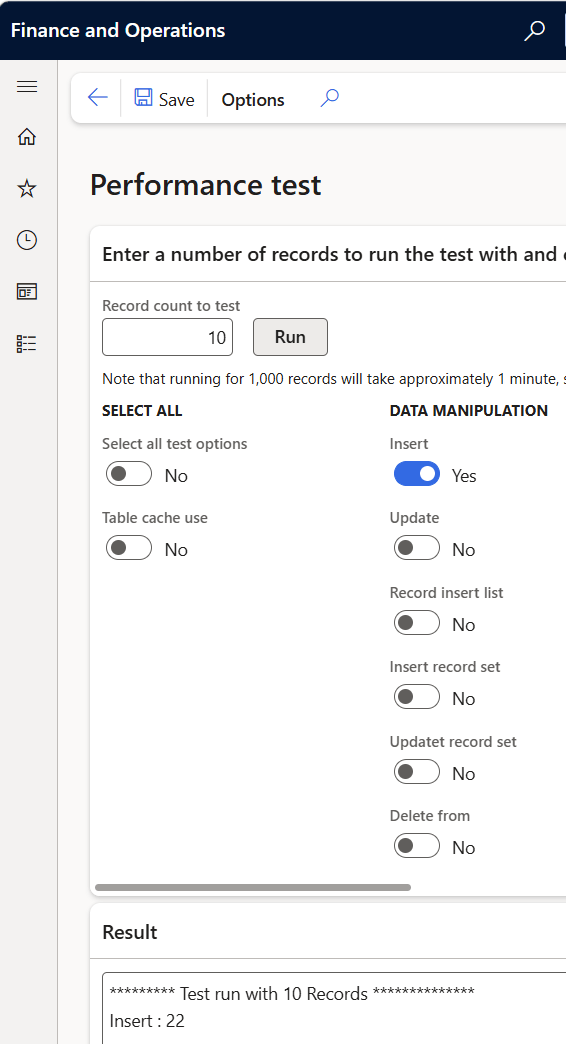
Open up the “Performance test” form, and only perform record count to test to 10 records, and only test insert:
Then you click “F12” to open the DevTools, and filter on “ProcessMe”.
As you click “Run” 10-30 times and look at the “time column”:
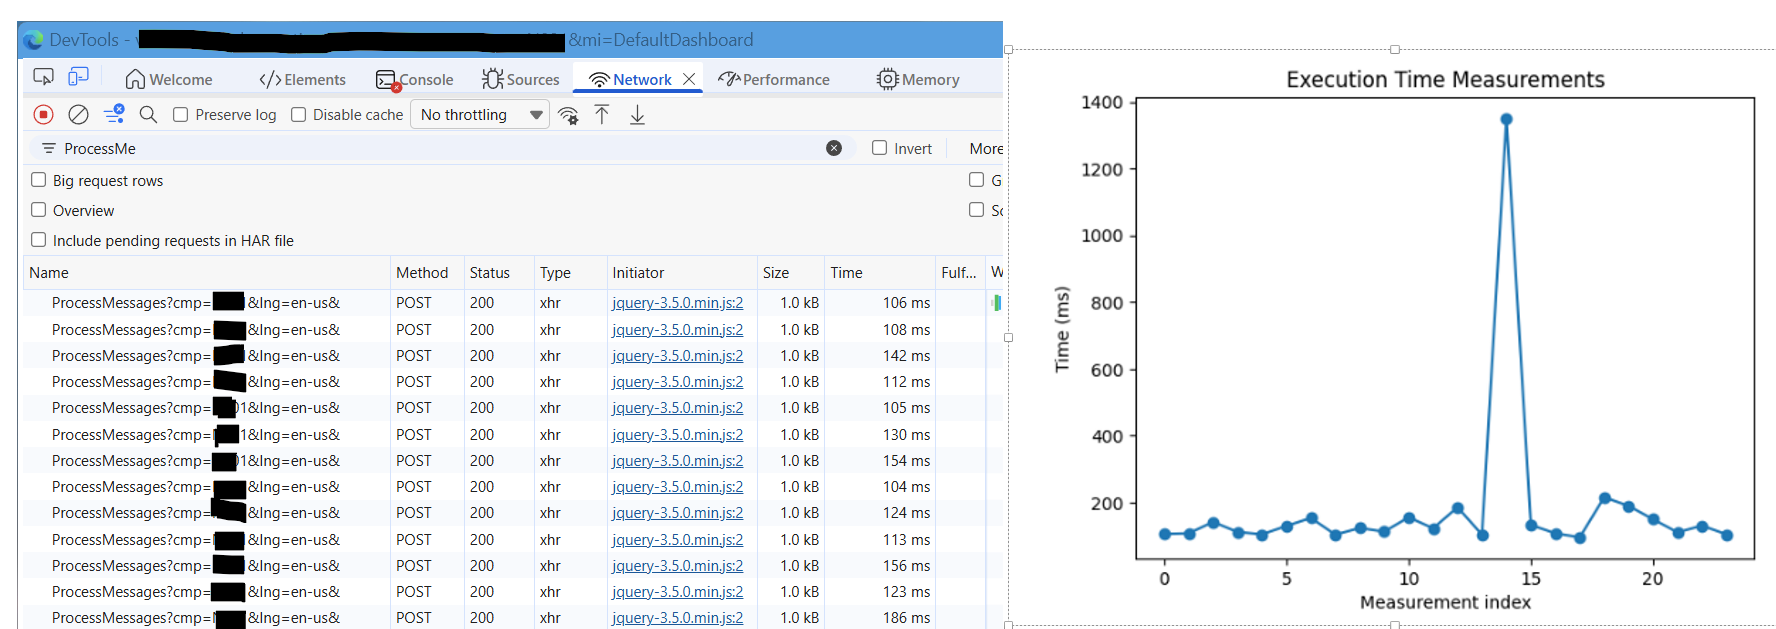
If you are on average between 100ms and 200ms, I think that the response time from the AOS are OK. A few spikes may happen.
But if your number are sometime seconds:
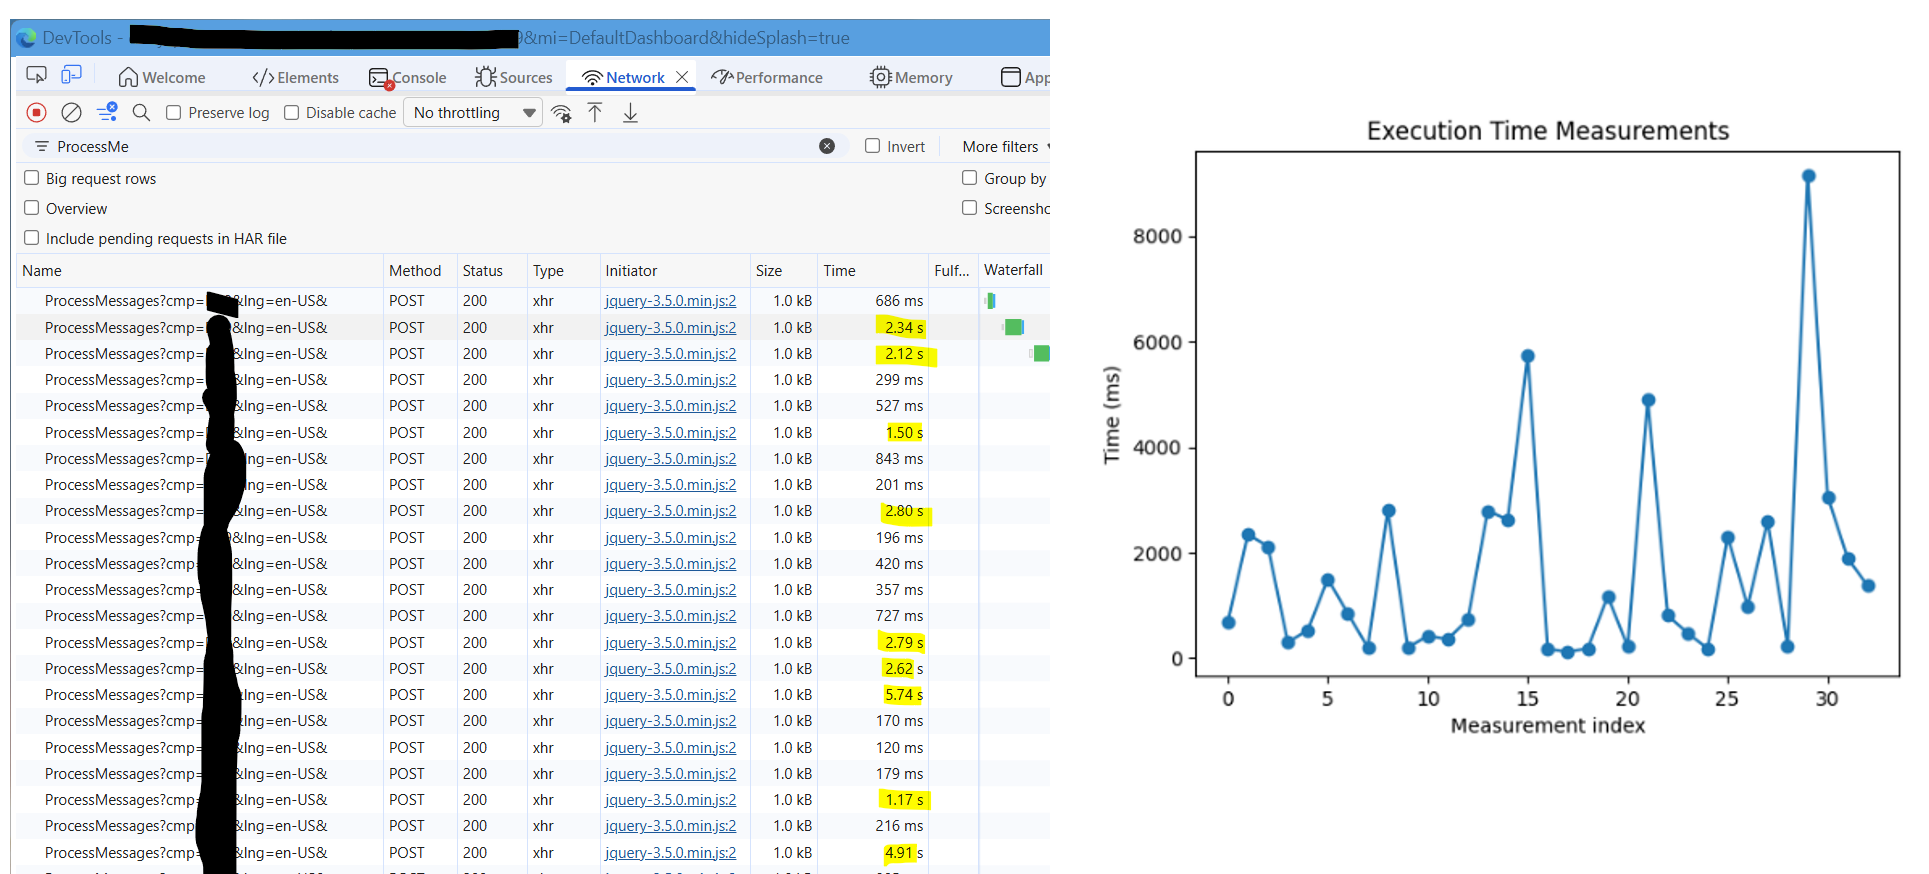
This means you are in trouble, and should probably create a support request. There is a high probability that something is not right, and a lot of users are not happy about the respons time of their application.
When I know the reason why I sometimes see such behavior, I’ll let you know.
Update 06/02/2026: It’s AOS memory! Ask for more, and the delays disappear 🙂 Normally we get 16Gb. 32Gb is much better.
