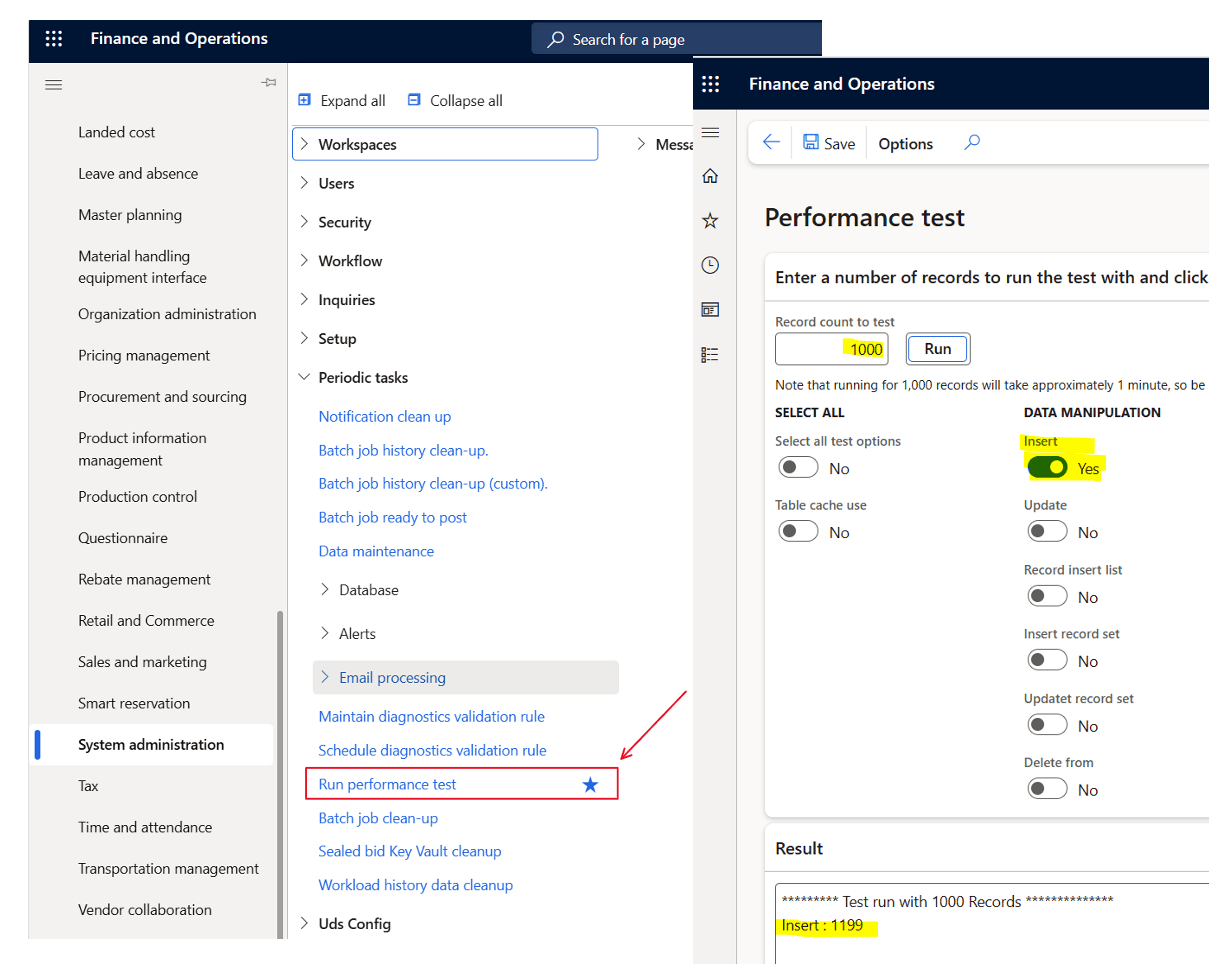
Did you know there is a very easy way to check if your core D365 database are performing OK. Use the tool ‘Run performance test‘.
There are no need to enable every test. Just focus on the insert of 1000 records.
What is shown is the number of milliseconds it takes to insert 1000 records. (You can go higher or lower to get better average). And remember to run it a few times to get a feeling of the average.
If your PROD performance on 1000 records is
less than 2000ms – You are good, and have great Azure SQL performance. I prefer to see 1000ms, but depending on load on your system
2000ms-3000ms – OK performance, but you should check that you don’t have AOS crashes resulting in SQL failovers. This is also the typical performance of a Tier-2 environment.
Above 3000ms – If it remains steadily above 3000, then something is probably wrong, and you should open a support case to have telemetry looked at.
You can also see the performance test in trace parser, and here is how it looks when doing 10.000 inserts in a OK performing PROD environment. exclusive average and 0.78ms/insert is quite ok.
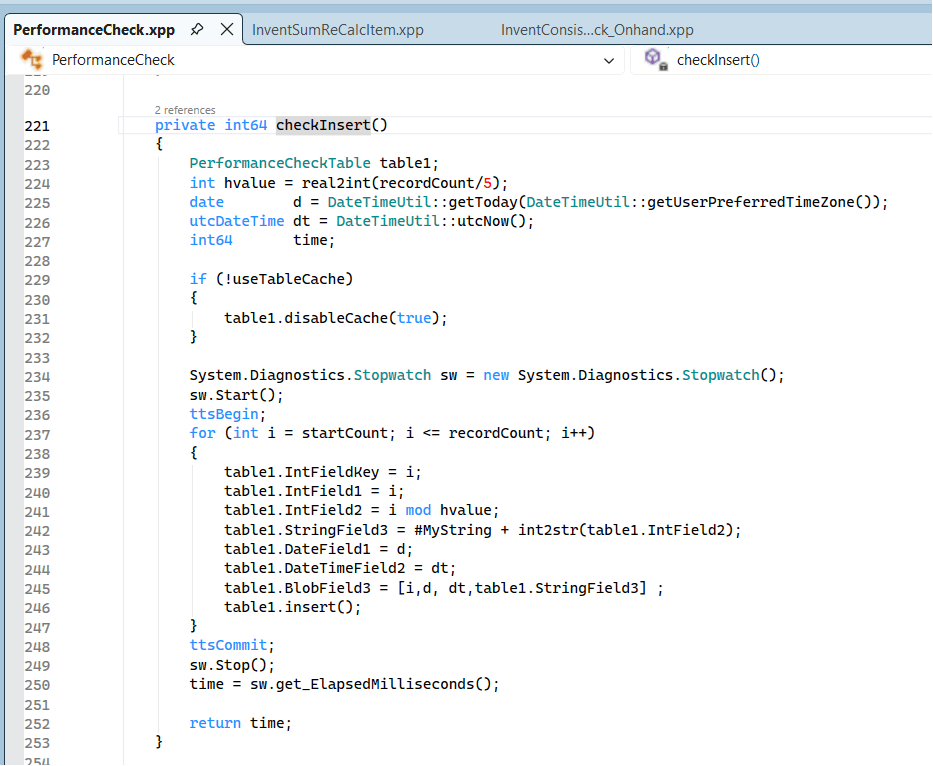
The code executed is basically just a loop inserting some fields in a table named PerformenceCheckTable.
The reason why this test is OK, is because it is only measuring the core performance of the Azure SQL. There are no additional code, complex queries, index problems etc.
When I performance test, I first do this validation to check that the base performance is stable, and that I have a well functioning platform. If this is OK, then I can do deeper and analyse performance on specific functionality covering queries, indexes and algorithms.
One reason I have seen of why the core SQL performance is below “good-performance”, is when there are customized code or ISV that actually crash the AOS. If the crashes happens too often, it seams to me that some disaster recovery mechanism is kicking in and this results in a different Azure SQL SKU or in a different cluster, that may have a lower performance. (We don’t have full insights to this)
So “ping” test your inserts if you wonder if the underlying SQL platform is acting a bit slow.
SysDA is a data access abstraction layer. Instead of writing raw SQL or direct select statements, SysDA lets developers build queries through objects (SysDaQuery, SysDaSelect, SysDaWhere, etc.).
Some benefits are:
Safer SQL generation
Better performance optimizations by the platform
Database-agnostic query logic
Protection against SQL injection
It essentially converts X++ query intent into SQL at runtime, while the platform can optimize or change behavior without code rewrites.
The SysDA framework was made available 2019 and there are a few blogposts and docs relevant to read to understand the benefits:
But when I look at both Microsoft code, ISV code and Partner code, I see a very low uptake on using this framework. Why ? The benefits are huge. Especially on performance. Nathan Clouse did perform tests in 2023 on Database Inserts and Performance and did show in the comparison blog post show real performance gains. As Nathan writes:
“for inserting records makes SysDA appear to be a no-brainer for workloads that demand high performance”
Despite the clear technical advantages, community adoption of SysDA has remained relatively low because most developers are already deeply invested in classic select statements and QueryBuild classes, which have worked reliably for decades. SysDA arrived late in the F&O lifecycle, shipped with limited documentation, minimal samples, and almost no public benchmarks showing real performance gains.
Without strong Microsoft advocacy, training, or tooling support, many assume SysDA adds complexity without offering tangible benefits. In addition, it is harder to debug, unfamiliar to consultants who are not pure developers, and optional rather than mandated.
The result is a technology that solves real performance problems, but sits under-used because the learning curve appears high, the payoff isn’t visible, and most customers don’t know it exists.
Dear community and Microsoft; Please use SysDA more! We need more power.
A SQL deadlock in Dynamics 365 occurs when two or more processes block each other by holding locks on resources the other processes need, causing a circular dependency that SQL Server cannot resolve without intervention. In the D365 context this typically arises during high-concurrency scenarios like batch jobs or heavy data imports where multiple threads compete for the same database rows or tables. The SQL engine resolves deadlocks by automatically terminating one of the conflicting transactions (the “victim”), which results in an error. In some situations, this also lead to DB fail and where sessions are moved to the secondary DB (That may not be scaled up as the primary DB)
So when experiencing sudden slowness and “strange” errors, please check in LCS for deadlocks like this, and start analyzing the call-stack.
One scenario I experienced when importing large sales orders in parallel, and where the sales orders have the same items. When having a lot of Commerce or EDI imports, it is common to place the entire sales order creation within the same transaction scope. Making sure that either is entire order is imported correct.
I would like to exemplify one specific instance that recently was identified together with Microsoft friends.
We experienced that frequently the D365 F&O started to be unstable and slow. And there where no clear indications of why. We could not repro. Customer reported sudden TTS errors, and that user get errors about losing connection to the DB. Typically, towards SysClientSessions.
Microsoft then carried out a deep analysis of telemetry, and the findings showed instances of frequent SQL failovers. Basically the DB failed, and the recovery mechanism moved the database sessions to fail-over DB clusters.
While going deeper, we found traces of deadlocks. It seems that DB architecture don’t like massive deadlocks, and when this happens, there are auto recovery mechanisms that kick-in to ensure up time and that users can continue to use the system.
In this specific instance the deadlock was caused by inserting a record table MCRPriceHistory, and the index RefRecIdIdx. This table is used for recording pricing details on the sales order. Finding deadlocks on insert are rare and a unicorn, and therefore I just had to write about is.
In this specific situation, there are two options :
1. Disable the Price History feature. (Unified pricing related), and wait for fix from Microsoft.
2. Create a support case to Microsoft, and ask for a index change on MCRPriceHistory, adding recid to the index RefRecIdIdx.
End note;
My main message to the community is to be aware of database deadlocks, as deadlock-escallation can have major impact on performance and may also trigger fail-safe mechanism in the Dynamics 365 architecture. And they are also very difficult to find and analyze. If you have deadlocks, please create a support case. I’m so grateful we as a partner have invested in Microsoft Premier Support, as this has been crucial to find root cause and final fix.
What I want to showcase in this blogpost is how to use results from the trace parser to analyze deeper, and see where the application is spending time, and to identify where there are optimizations in the application.
As the application works as designed, there is no point in creating support cases towards this, as these findings are not bugs but optimalization opportunities, and how we from a statistical analysis can extract knowledge and identify R&D investment areas.
My own conclusion on how to improve the paste-to-grid performance is:
Reduction in number of DBcalls needed to create a sales order line. This involves reevaluating code and approach. Saving milliseconds on high frequency methods and reducing DB chattiness means saving mega seconds in the overall timing.
Additional improvements are needed in the Global Unified Pricing code to further optimize calls and reduce the number of DB calls performed. Also explore the possibility to reduce the need for TempDB joins and replace with SQL “IN” support in X++.
Establish a goal/KPI for sales order line insert when copy/pasting into grid, where the acceptance criteria on a vanilla Contoso environment is minimum 1s per line.
Setup of the analysis
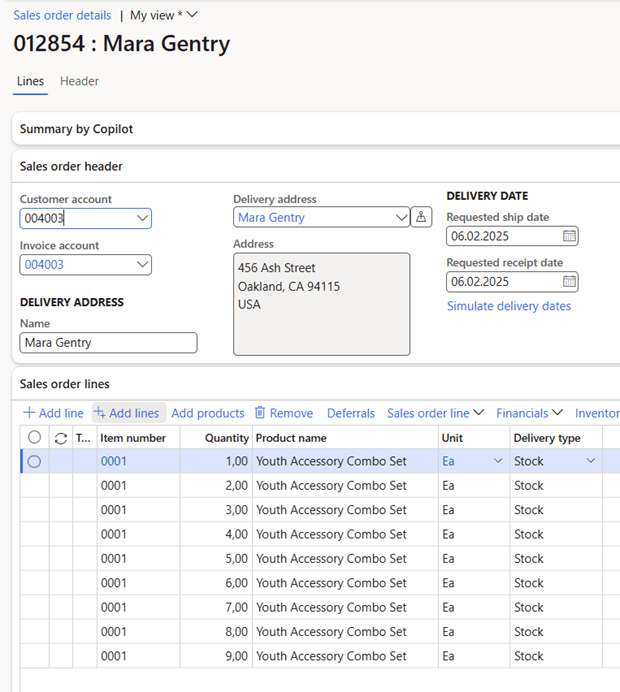
The following analysis has been performed on Dynamics 365 SCM version 10.0.43 on a Tier-2 environment, and the analysis is quite simple to paste 9 sales order lines into the grid like this:
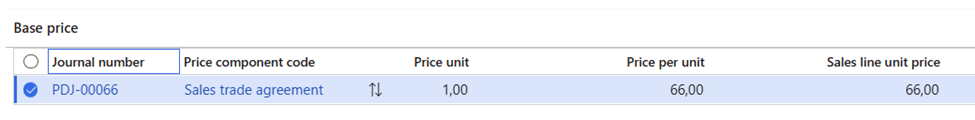
Company USRT, and the product 0001 only have one base price setting the price per unit to 66 USD:
The analysis was performed using Traceparser and then analyzing the results in Excel.
Some overall facts
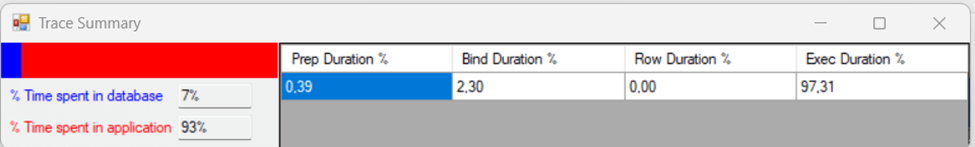
To create 9 sales order lines took 36.823 ms of execution in total, where there were 5.794 database calls that took 15.771 ms. In total there were 655.025 X++ entries/method calls in the trace. The average execution time for a SQL statement was 2,72 ms, and the average X++ methods execution time(exclusive) was 0,0321 ms. The average time per sales order line is in total 4.091ms
The Trace Summary indicates that 7% of the time was spent in the DB, and 93% was spent in the application(x++).
This indicates that for this analysis, that the DB and caching is fast and warm.
Analysis of code call frequency
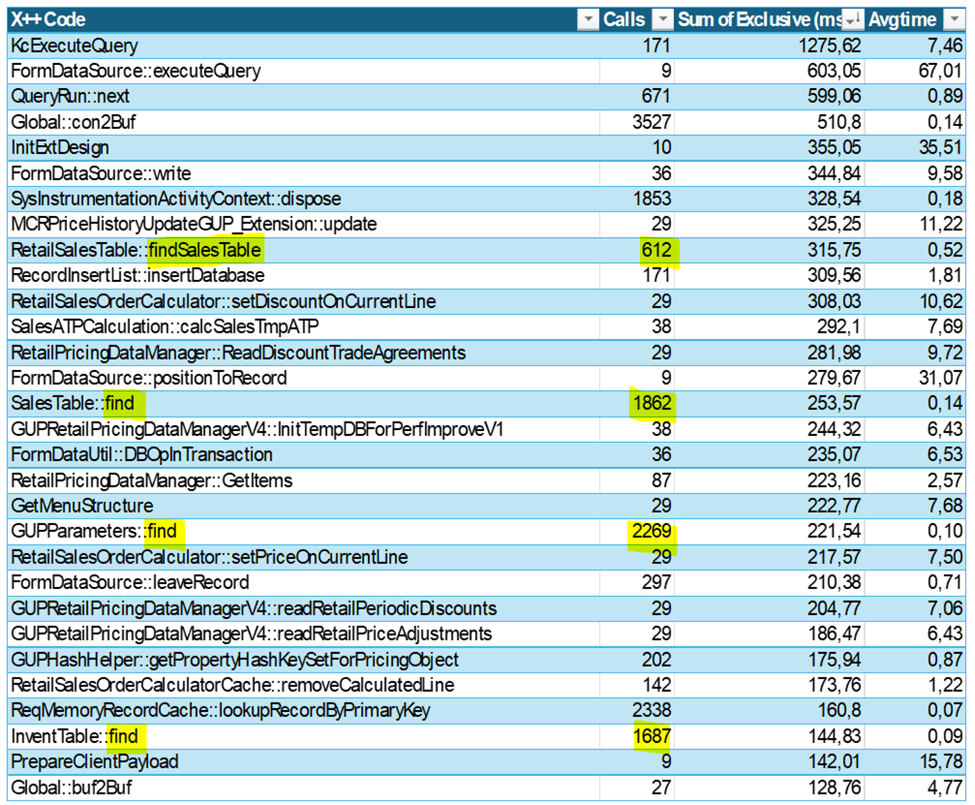
Call frequency indicates how many times the same code is called. If we look at the top 30 methods called, these account for 44% of the X++ execution time.
We can observe that the method Global::con2Buf is called 3.527 times. The main source of why this have a high frequency is associated with the SysExtensionSerializedMap that is related to normalization instead of extending tables with lot of fields.
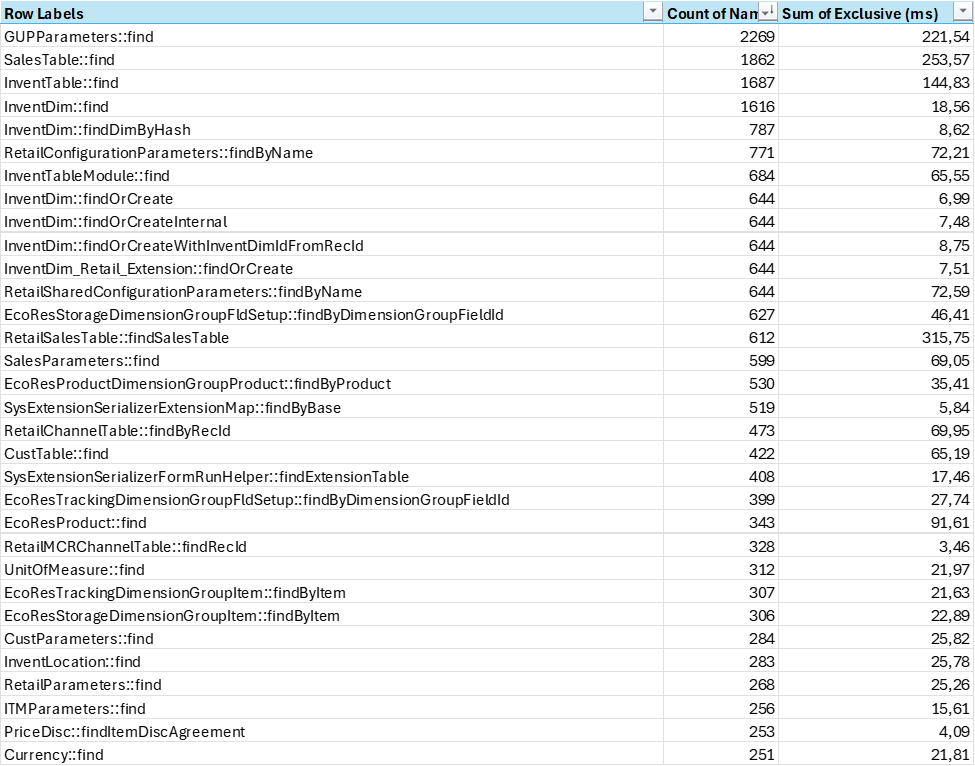
One interesting observation is that if we see that the average execution time for methods containing the string “Find”, this is 29.624 calls(4,5% of total), and sum execution time accounts for 3.101 ms (14,7% of total). As the number of calls to find() is so high, there are indications that there are an overhead of data transferred to maybe just find a single a value. Reusing table variables within an execution could reduce time spent on finding a record (even though we are hitting the cache).
Global Unified pricing and tempDB
If we look at code that is related to the most time-consuming part of sales order line creation it is related to price calculation. In total there are 36.564 calls (5,58% of total) towards methods associated with GUP, and this accounts for 2.844 ms (13,5% of total).
I see some improvements areas where there are high frequency calls, that could benefit from additional caching and keeping variables in scope. If there were possibilities to keep variable values across TTS scopes, there could be some additional savings.
If we look at the SQL calls that is related to Global Unified Pricing there are in total 1.138 calls (19,64% of total calls), and the DB execution time is 8.791 ms (55,74 % of total db execution time)
The costliest calls (75ms each) are being made in GUPRetailPricingDataManagerV3::readPriceingAutoChargesLines() and are related to finding price componentCode, and match these with auto charges and attributes on the products. The use of tempDB tables in these joins is causing some delays as the hash values need to be inserted into a temporary table, and after exiting each TTS scope they need to be recreated again.
The use of tempDB for joins is something that have been increasingly used through the codebase the last few years. If we look at the total number of SQL calls, involving tempDB, there are 1184 SQL statements( 20,61% of all) involving tempDB. Time spent on executing statements involving tempDB joins is 10.396,87 ms (65% of total)
A 75 ms execution time for a query with this level of JOIN complexity is not unusual. It is unlikely that the temporary tables are the primary culprit. Instead, the overall join strategy and how the optimizer handles the multiple cross joins and filtering conditions are more likely to be the factors influencing the execution time. But if able to avoid tempDB, there could be an additional 5-15% saving in execution time by using SQL “IN” or “NOT IN” statements. But as X++ currently do not support SQL “IN” in X++, I guess the approach would be to restructure the statement, ensuring that the smallest tables are earlier in the statements.
Feature management
On interesting fact observed is that we see checks and validations towards feature and flights to have an effect on the performance. In total, there are 19.561 method calls in the trace related to feature checks. The checks are fast, but the frequency is very high. This tells me that the code paths and feature management is very tightly integrated, and feature states highly influences execution paths.
In the world of performance tuning, tiny tweaks in code that runs thousands of times can add up to massive gains—think of it as the compound interest of optimization. A few milliseconds shaved off here and there may seem insignificant on their own, but they can quickly turn into a tidal wave of savings. So, remember: when it comes to high-frequency calls, every little improvement can make a big splash! And if you still try to find the needle in the haystack for the single code that improves everything, remember that there are no haystack; Only needles.
Through my career, performance have been a returning topic, and I have tried to share as much of my knowledge as possible. Today I would like to write about the .initValue() method, that is actually more costly than you think. Even if is empty.
I did a traceparsing to better understand the performance of inserting 10 sales order lines, that I feel is far below acceptable performance.
The Traceparser looked like this, and I was focusing on queries and statements that was unusual highly frequent for inserting 10 sales order lines. Specifically there where 548 calls towards a table named SysClientSessions.
SELECT {fields} FROM SYSCLIENTSESSIONS T1 WHERE (SESSIONID=61852)
Why would inserting 10 salesorder lines result in 548 db calls on the session table? I looked at the callstack, and realized that the original source was from the .initValue() methods, that triggers a chain of events, and deep into the call stack I see that there is a call towards Global::isRunningOnBatch() to validate if my client is in a batch or in a GUI.
The issue is that SYSCLIENTSESSIONS not cached. It is set to “none”, meaning that any queries will always hit the DB.
But why are the .initValue() executed so many times?
It seems that for misc charges a table is used as a search paramater table as shown here, and in this process, it starts with executing .initvalue()
Code like this are stealing milliseconds from the execution, and this is just a very small example showcasing why deeper trace parsing in Dynamics 365 F&O are needed.
To achieve better performance Microsoft must start looking for unneeded high frequent queries and take them seriously. Even though this small extra query is only 0,83 ms per execution, the total amount is close to 0.5s as it is executed 548 times. In addition there will be latency and AOS processing time throw-out the callstack for each query.
I have encountered many similar situations, and I try to report them to Microsoft support. In most of the cases it returns back with “as designed” conclusion, and where support do not consider this as a bug. But if these minor details would get focus, the sum of such improvements would really speed up the Dynamics 365 F&O performance. Should I add them to the ideas site to die?
We in the community want Dynamics 365 to be the best solution ever, and fixing the minor things can really make a major change. I hope that Ostrich algorithm is not becoming an official Microsoft approach to minor issues, as what is actually wanted is perfection and not excuses.