D365 : Use your data

When I observe the use of Dynamics 365, I often see that most often there are well-established processes and routines for getting data into the Dynamics 365 system. But using this data is often limited to retrieving financial reports that show everything in dollars and cents. However, the information contained in the system is often of high value, but to effectively use of the data has not been implemented. The reason for this is often simple; One does not know how. And often it can end up in overcomplicated enterprise scale solution that costs much more than needed.

Here is a small list of what is standard, and quite quickly can expose the data to reporting, like Power BI and Excel

  1. Data export
    This is the easy way, where you select data entities to be exported as Excel sheets, CSV or XML. Manual, simple and requires very little demanding in setting up.
  2. ODATA
    Odata is also a very simple and easy way to get access to Dynamics 365 F&O data, and can be consumed directly in Power BI. But it is slow compared to the other ways, and I don’t recommend using this to transactional data. Use of OData for Power BI reports is discouraged. Using entity store for such scenarios is encouraged.


  3. BYOD – Bring your own database
    In Dynamics 365, you can set up an Azure SQL database, as a destination when exporting data. Power BI can then read directly from this database. This makes it easy to access the data. But an Azure SQL database can be expensive, and in the long run this way of exporting data will probably become less common. Data Lake will be taking over more for this form of exposing data.
  4. Entity stores are analytic cubes that are already in place in the standard solution. When you go into the different work areas, there are already many Power BI embedded analyzes that can be used directly. But the very few are aware is that these cubes can be made available in a Data Lake, so they can be used in reports that you create yourself. Dynamics 365 updates data lake continuously and there is a short delay until the data is available in Data Lake (trickle feed). I’m a but surprised that very few customers are using this option to create additional Power BI reports, and even to be able to open the data flows directly in excel. You literally can just select your dimensions and measurements directly from the entity store data lake. Why are almost nobody using this standard feature?


  5. Dataverse og dual write
    Dual Write is a built-in solution, where the data in Dynamics 365 is synchronously updated between the various apps. Typically, this is used to have shared registers between “customer engagement apps” and “Finance and Operations apps”. But in reality, you can use the entities you want.


  6. Virtual entities
    With virtual entities, the data is in Dynamics 365 Finance and Operations, but they are exposed as entities in Data Verse. (It could be that you need to use the legacy connector to access virtual entities in Power BI)
  7. This is the solution that will really give the data value in the future. In a future release, it will be easier to set up which tables and entities are to be written in Data Lake in almost real time. But it is not only the data that is written, but also metadata that can describe the information and relationships. So keep an eye on the roadmap on this.

These ways of exposing data can be set up as data flows that can be subscribed to. Not just Power BI but also Excel or other services that need this data. In Power BI you can subscribe to several data sources, so you can build the visualization and analysis that is desired.

Then comes the big question; Is it a lot of work to set up? What you may not be aware of is that a lot of this is already part of Dynamics 365. It requires very few hours to set up, and Power BI is also something that is relatively easy to use.

One exciting area that comes in the wake of this is to link this to MachineLearning / AI directly from Power BI. So that the system can build up prediction models, which see the connection between the data and which come with predictions. Dynamics 365 Finance comes full of solutions that give good indications of when customers will pay, suggestions for the next budget or how future cash holdings will be. Within trade / retail, there have been solutions for product recommendations based on customer profile and shopping cart.

The value of your data is determined by how you use it, and the first step is to make it available for use.


D365 – CustTable – fast – faster – fastest – WOW!

I wanted to look deeper into an area that have troubled me for some time. Why are some forms very fast in D365, and some forms do not have the expected start-up time. At the end of this article you can see my finding, and I hope this will have an positive effect on user experienced performance.

The form I wanted to take a deeper look into is the custTable form, as this is one of the most used forms at customers. Over time we have seen that this form has increased in size, by additional features and code being added. New features are great, but it comes at a cost.

I wanted a simple test, where we are looking at a warm system, and time how long time it would take to open the CustTable form. I would like to test the opening of custTable a Cloud Hosted Tier-1 (DS12 V2), Tier-2 and PROD. This is benchmarked with a top-watch, and timing is from I click on menu item, until form is drawn and responsive. I will be using google chrome with F12, and measure until all network, and the main measurement will be TTFB (Time To First byte), as seen in the picture below. The actual waiting time tend to be beyond this, but it is the most concrete KPI I have found. The timing is therefore not the actual or experienced performance, but a KPI that can be used for comparing scenario’s.

The KPI represents the time the AOS/IIS is using to render and return the form object to the browser. Each “warm test” will be conducted 3 times, and the data is an extremely small dataset (just a few customers), as the purpose of this test is NOT to test the database, indexes or queries. It is about testing how the execution of code and caching on a form is performing.

Below is a screenshot showing where to find my performance KPI in the F12 Google chrome developer menu.

Test of architecture

In this test I’m testing how fast the custTable form is opened on Tier1, Tier-2 and on a PROD environment. The PROD/Tier-2 environments are on service fabrics(self-service), and the databases seams to be elastic pool based.

As seen on the table below the fastest execution happens on Tier-1, that is a one-box SQL, and the Tier-2 and PROD

Customer form

Warm execution

Cold execution

Tier-1 (DS12 V2)

1.50, 1.49, 1.49

22.99

Tier-2

2.20, 2.32, 2.20

16.96

Prod (6 AOS’s)

3.22, 3.25, 3.10 (20:00 CET)

2.37, 2.46, 2.40 (22:00 CET)

Not measured

What we here see is that a cold execution of the CustTable form is extreme, with a dramatic increase execution time. What we also see is that PROD differs on execution time. This can be because of different connection to another AOS, or affection of “noisy neighbor” caused by switch to Azure SQL elastic pool architecture.

On a simpler form like the “customer reason code” form, without much code, we see a very nice execution time on all tier-levels, and even cold executions are within acceptable range.

Customer reason code form

Warm execution

Cold execution

Tier-1 (DS12 V2)

0.11, 0.11, 0.12

1.01

Tier-2

0.26, 0.27, 0.26

0.98

Prod (6 AOS’s)

0.27, 0.28, 0.23

Not measured

The conclusion seams that complex forms, as the custTable are much more affected when opening a form in a cold state.

The complexity of the CustTable

As seen below, the CustTable contains 12 datasources, and quite many of them are joins. There are also 4 extension to the form.

We also see in the code in the CustTable is heavily regulated by code that controls features, country specific/regulatory elements, and display items. If we open the Customer form on a Tier-2 environment with 5 customers takes between 2-3s. In total there are 16.413 method calls, and of them 1.330 are unique method calls.

I did not get any meaningful information out of the recorded summarized tracefile analysis, so I must continue to more manually look into the actual execution of code.

Test of effect when reducing complexity CustTable

My next step in the analysis is to see what is affecting the execution time. In the following section I’m testing in a Tier-1 D12V2 environment. I have made 5 copies of the CustTable form, in each form, I’m removing more and more code and data sources. I name them:

  1. Standard, but no calls to feature enablement
  2. Fast : All code and data datasources removed, except custTable and DirParty
  3. Faster : All code and data datasources removed, except custTable. Display method on customer name
  4. Fastest; All code is removed except CustTable data source

To simulate a “cold execution” we can flush the cache by adding the following to the URL: &mi=ACTION%3ASysFlushAOD

CustTable form type

Warm execution (s)

Cold execution (s)

Standard 10.0.18

1.50, 1.49, 1.49

22.99

1.Standard, but no calls to feature enablement code

1.34, 1.43, 1,39

17.94

2.Fast : All code and data datasources removed, except custTable and DirParty

0.72, 0.72, 0.73

1.22

3.Faster : All code and data datasources removed, except custTable. Display method on customer name

0.56, 0.62, 0.57

0.96

4.Fastest; All is removed except CustTable data source

0.34, 0.34, 0.38

0.49

5.Customer reasoncode form

0.11, 0.11, 0.12

0.32

What we see in the table above, is that the main thing that is taking time, is the execution of code. The datasources do not affect the user experienced performance in this scenario. The results show that simpler forms with less code have a huge effect of the execution and the cold-start scenario.

WOW! – Other findings.

I have found one area that is affecting heavily the cold startup of forms. That is the office button, that is typically initiated when the form is loading. I tried disabling the office button code, a cold startup of CustTable went from 23s to 5s. And this button is used everywhere.

This “fix” does not seam to have a large effect on warmed up system. But keep in mind that with the one-version strategy and adding extensions we are clearing any cache quite often, that the end-users needs to rebuild on each AOS. As there are thousands of forms, you can multiply the warmup with the number of AOS’s, and you realize why manual warmup take days.

I have informed Microsoft, and hope for a positive response. Let’s continue to dig for code changes that can make the best ERP system even better, and share what you find.

I realized, that when debugging line-by-line, a small gray text pop’s up showing the actual elapsed execution time per statement. This allowed me to find the lines that actually are using a lot of time, by jumping from line to line. The timing here, is from when I did a debug of a cold system. On a warm system it will not show, as then it all is cached.
I’m really proud of finding this, as it have been on my bucket list to find some real good improvements. For more details on the chase for more performance, take a look at the Microsoft Yammer group (If you have access?) https://www.yammer.com/dynamicsaxfeedbackprograms/threads/1105410564505600

D365: Search for code with Agent Ransack

When supporting customer’s we often can get small fragments of information on an issue, like a form is not performing as expected, or an error message. The procedure is then often to log into LCS and find traces of the issue. Often we end up with a query that is the source of the issue. But to better understand and analyze how to fix the issue we often need to find exactly in the source code where the query is executed. By also being more exact and precise towards Microsoft support you also get quicker response.

Searching through the code in Visual Studio can be time consuming, and the built in Cross reference is not always updated, but there is an alternative I can recommend. Agent Ransack is a free file searching utility that quickly can scan most D365 source code (the *.XML files placed in K:\AosService\PackagesLocalDirectory\).

Let’s say I see in the LCS that the current query is what I need to find out from here it is executed.

From the query I can then search for the text “Join RetailEODTransactionTable”, and I get 25 results, and even where the exact table is not specified as

I can then open the file in explorer and then validate to see if I need to go into Visual Studio for further analysis.

This speed up the process of finding the source code that you are looking for. It is free and download it from https://www.mythicsoft.com/agentransack/ and install it in you development environment.


Take care Daxer’s.

Dynamics 365 F&O – Selecting the correct Tier level on your sandboxes

When purchasing Dynamics 365 F&O, you a get of Microsoft managed (but self-service) environments that is included with the standard offer. (Production, Tier-2 Standard Acceptance Testing and a Tier-1 Develop/Build and test environment. Microsoft have described this on the environment planning docs. I will not discuss Tier-1 environments here, as these environments is optimized for development experiences. Do not perform performance testing on a tier-1 environment.Tier-2+ environments is based on the same architecture as a production environment and uses the Azure SQL Database service.

When running an implementation project, it is common to purchase additional tier 2+ environment that is used of different purposes as shown in the table below (from Microsoft Docs)

Selecting the correct level is important and is depending on what the environment is going to be used for. As a guidance, Microsoft have the following baseline recommendation:

On the projects where I have been involved, we most often have 3 or 4 Tier 2+ environment and the purpose are changed through the project.

The flow of data between these environments can be included into a Sprint Cycle. The process will start with defining the general parameters in the golden configuration environment (1). Here all system setup, number sequences, and master data will be uploaded/entered from the legacy systems. The Test/Stage/Migration environment (2) will be created based on the golden environment + transactional data packages/initial startup data. Then there will be a database refresh from Test (2) à UAT (2), where all test scripts will be run and approved. The results and configuration changes/master data are then fed into the golden environment ready for the next data movement cycle. The reason why we do this, is to ensure that the golden environment and the migration environment is not corrupted through testing. At Go Live, and when the UAT is approved (after a few iterations), then the Migration environment will be copied to the production environment. This can only happen once. Subsequent updates to the production environment must be done manually or using data packages.

(1)- Tier-2 Golden environment (before PROD have been deployed). This environment is often changed to become staging environment that contains an exact replica of the production environment. I prefer golden environments as a Tier-2, as this simplifies the transfer of data using the LCS self-service database refresh.

(2)- Tier-2 data migration. This environment is used for making transactional data ready for being imported to the production environment at Go-Live.

(3)- Tier-2/3 User acceptance. Here the system is really tested. Lot’s of regression testing and running test scripts. The focus is functionality. If there are concerns on performance, a Tier-5 environment can be purchased for a shorter period to validate that system can handle the full load of a large-scale production environment. For performance testing, it is recommended to also invest in automation of the test script. (Unless you ask the entire organization to participate in a manual test).

The performance of a system is a combination of the raw computing power of the VM’s hosing the AOS, and the sizing of the Azure SQL. With Dynamics 365 we don’t have any way’s of influencing the sizing of this. It is all managed by Microsoft, and they will size the production environment according to number of users and transactions per hour. But the Azure SQL boundaries that Microsoft is most often related to the following sizing steps.

I don’t exactly understand how Microsoft is mapping the Tier-2..5 towards these steps, but I have experienced that a Tier-2 level in some cases are a P1, P2, P4 and P6. More information on the DTU capacity can be found here, and the summary is that we can expect 48 IOPS per DTU. So, a P6 will provide 48000 IOPS. If you want to check your DTP limit, then open SQL manager towards the Azure SQL database, and execute the following script:

SELECT
*
FROM
sys.dm_db_resource_stats ORDER
BY end_time DESC;

And then the DTU limit should be shown here: This is from a Tier-2 environment belonging to the initial subscription, and this seams to have 250 DTU’s(P2)

But what puzzles me is if I go into another Tier-2 add-on environment I have 500 DTU (P4)

And in the third Tier-2 add-on environment I have 1000 DTU (P6)

So there seams not to be a consistency between the DTU’s provided and the Tier-2 add-on purchased. As far as I know, in this case the production environment is 1000 DTU’s(Or P6) in some of my customers.

The AOS’es on the Tier-2 environment seams to mostly be D12/DS12/DS12_v2 with 4 CPU and 28 Gb RAM and 8x500Gb storage, capable of giving out 12.800 IOPS.

What also puzzles me is the number of Tier-2 AOS’s that is deployed. Some environments have one AOS, and one BI server.

While other Tier-2 environments have two AOS’es and one BI server

I assume that the differences are related to how the subscription estimator have been filled out, and that this may have an impact on what is deployed as sandbox Tier-2 environments.

Dynamics 365 do have some performance indicators under the system administrator menu, that gives some numbers, but I cannot see a clear correlation between the environments and the performance. Maybe some of you smart guys can explain how to interpret these performance test results? What is good, and what is not?

If we take the “LargeBufferReads”, how does your environments perform?

Dynamics 365F&O – Enabling new hidden functionality (SYSFlighting)

With Dynamics 365 version 10, the innovation wave from Microsoft is continuing to accelerate. All customer will use the same base source code of the Dynamics 365 solution, and it will be maintained and updated every month. But for many customers, stability also have its value. New functionality every month is not always what existing customers want to implement. New functionality could mean new trainings and new testing. Me on the other hand loves new features, because it enables new possibilities and solutions.

Microsoft have a solution for this, and that not all new functionality is enabled by default. Instead, the new functionality must be manually enabled based on support request through LCS. Two specific functionalities that is already documented is new functionality in Data Management framework and Business events. In the documentation pages you can see how to enable this hidden functionality, but the essence is that you have to run a SQL commend (only available for non-production environments) :

INSERT INTO SYSFLIGHTING (FLIGHTNAME, ENABLED, FLIGHTSERVICEID) VALUES (‘XXXXX’, 1, 12719367)

PS! This is NOT something you can enable by your self in a production system.

A small tip, to search for in Docs.microsoft.com is the term “SYSFLIGHTING“. And then you will see the articles on documented hidden features.

But there are more, but undocumented features in two categories; Application and Platform. And these can be seen as two macro’s in the source code, named ApplicationPlatformFlights and ApplicationFoundationFlights. I have taken a snapshot of them here and based on the names we do get some indication of what they are used for. What they are, and how to use them I expect will be documented in the future.

PS! I look forward in exploring the “AnalyticsRealTimeReporting“, “DMFEnableAllCompanyExport“, “AnalyticsReportWebEditor“, “BusinessEventsMaster“, “ApplicationPlatformPowerAppsPersonalization“.

Happy Flighting

Retail assortments and planned orders extensions

Microsoft have created an excellent description of this in the Assortment management doc-page. Retail assortments are essential to define what products that should be available across retail channels. Assigning a product to an assortment, will assign the product to the stores that have the assortment. This makes it possible to sell the product in the store.

But there is something missing, and that is to use assortments for replenishment and procurement. Retailers want the master planning to only suggest procurement and transfers on products that belongs to the stores assortments. You can control requirement parameters per warehouse, but there is no standard way to use the assortment to control the generation of planned orders.

This blog post is to show how to make a very small extension that allows you to make sure that only products that belongs to a stores assortment will generate planned orders. The solution I will make use of is to look into how the product lifecycle state functionality is working, and extend this with an assortment planning parameter. I have called this parameter “Is lifecycle state active for assortment procurement

What it will do, is to validate if a product is in the assortment of the store, and if it is, then the product will be requirement calculated and will generate planned orders. If the product is not in the assortment of the store, that no planned orders will be generated.

To make this happen, I needed to create 4 extensions. The three first is adding a new field on the product lifecycle form.  For an experienced developer this is easy to create, and no need to spend time on in this this blog-post.

The real fun is how to manage and control the planned order generation. This happens in in an extension to the ReqSetupDim class.  Here there is a lookup to the assortment on the product, and checks if the store have this assortment.  If not, then the masterplanning will not generate any planned orders. I therefore create an extention class and use the new method wrapping/CoC feature to add some additional code.

///
<summary>
/// Contains extension methods for the ReqSetupDim class.
/// </summary>

[ExtensionOf(classStr(ReqSetupDim))]
final class ReqSetupDim_extension
{

    ///
<summary>
    /// Validates if a product should be assortment planned
    /// </summary>

    /// The parm of the ReqSetupDim class.
    /// false if the product is not assortment planned; otherwise, return default value.
    public boolean  mustReqBeCreated(InventDim _inventDimComplete)
    {
        Boolean ret = next mustReqBeCreated(_inventDimComplete);

        if (ret)
        {
            if (inventdim.InventLocationId)
            {
                InventTable                 inventtable;
                EcoResProductLifecycleState ecoResProductLifecycleState;

                //Fetching fields from  inventtable
                select firstonly ProductLifecycleStateId, Product from  inventtable where inventtable.ItemId == this.itemId();

                //validating if the product is active for planning and that also assortment planning is enabled.
                select firstonly RecId from ecoResProductLifecycleState
                        where   ecoResProductLifecycleState.IsActiveForAssortmentPlanning == true
                            &amp;&amp;  ecoResProductLifecycleState.IsActiveForPlanning == true
                            &amp;&amp;  ecoResProductLifecycleState.StateId == inventtable.ProductLifecycleStateId;

                if(ecoResProductLifecycleState)
                {
                    RetailStoreTable                    store;
                    EcoResProduct                       product;
                    RetailAssortmentLookup              assortmentLookupInclude;
                    RetailAssortmentLookup              assortmentLookupExclude;

                    RetailAssortmentLookupChannelGroup  assortmentLookupChannelGroupInclude;
                    RetailAssortmentLookupChannelGroup  assortmentLookupChannelGroupExclude;

                    //Finding OMOperatingUnitID from the inventlocationId
                    while select firstonly OMOperatingUnitID from store
                        where store.inventlocation == inventdim.InventLocationId
                    {
                        //Check if the product is in the assortment of the store in question
                        select RecId from product
                            where product.RecId == inventtable.product
                        exists join assortmentLookupInclude
                            where   assortmentLookupInclude.ProductId == product.RecId
                                &amp;&amp;  assortmentLookupInclude.lineType == RetailAssortmentExcludeIncludeType::Include
                        exists join assortmentLookupChannelGroupInclude
                                where   assortmentLookupChannelGroupInclude.OMOperatingUnitId == store.OMOperatingUnitID
                                    &amp;&amp;  assortmentLookupChannelGroupInclude.AssortmentId == assortmentLookupInclude.AssortmentId
                        notexists join assortmentLookupExclude
                            where   assortmentLookupExclude.ProductId == product.RecId
                                &amp;&amp;  assortmentLookupExclude.lineType == RetailAssortmentExcludeIncludeType::Exclude
                        exists join assortmentLookupChannelGroupExclude
                            where   assortmentLookupChannelGroupExclude.OMOperatingUnitId == store.OMOperatingUnitID
                                &amp;&amp;  assortmentLookupChannelGroupExclude.AssortmentId == assortmentLookupExclude.AssortmentId;

                        if (!product)
                        {
                            ret = false; //The product does NOT belong to the stores assortment, and should not be planned
                        }
                    }
                }
            }
        }
        return ret;
    }
}

I also have code to restrict creation of manual purchase orders, and where simular code can be used, but let’s hope that Microsoft can further extend standard Dynamics 365 with assortment based procurement planning.

Copy with pride, and let’s hope next year will give us 365 more opertunities.

Retail category managers, Simplify your import of released products in #Dyn365FO

It is a category manager’s job to try to maximize profit from selling products within a specific category. This may be looking after a broad category such as ‘confectionery’ or they may focus closely on a more specific category, such as ‘snacking’. A category manager will analyze complex data collected on shopper behavior from a range of different sources, and then translate it into meaningful information. The category manager’s duty is to ensure that their company is providing the market with the products that consumers desire.

Retail Category managers love Excel. It is used for almost everything, and they perform much of the analyzing, lookup, data collection and decision making in Excel. When implementing Dynamics 365 we are often faces with large set of excel spreadsheets that needs to be imported. I have seen users import 8 different excel spreadsheets for importing products. This blog post is about how to simplify the process of keeping retail master data in single excel sheet and easily importing and updating products. For this, Dynamics 365 data management framework is used. One of the problems I often se uses are struggling with, is the issue that the source excel spread sheet is a single spreadsheet, but it needs to be imported into several data entities. For a retailer some of the most common master data entities are:

Data entity

Description of data entity

Products V2

Contains Product number, Product name and dimension groups

Released products V2

Contains most fields on the released product

Item – bar code

Contains the item barcodes used for scanning

Default order settings

Contains information like minimum purchase quantity etc.

External item descriptions for vendors

Vendors item numbers and descriptions

Product category assignments

The connection to the retail category hierarchy.


It is possible to create a single excel spreads sheet that overs all of these entities, and in a single run import or update the retail products.

So how to exactly do this?

Create an Excel spreadsheet with exactly the following.

I recommend creating two sheets. First one is a “read me” sheet, that explains the “template” sheet.

Use exactly the column names as described here. This will make the mapping between the columns and the data entity automatic. Here I also use color coding to show what entity each column mainly belongs to.

Field

Example Value

Comment

Tables

ITEMNUMBER

1005157

Product number

Released Products, Products

PRODUCTNUMBER

1005157

Product number

Released Products

PRODUCTNAME

Jalla Coffee 500G

Item name

Released Products, Products

PRODUCTSEARCHNAME

4001392 Jalla Coffee FILTER 500G

Seach name

Released Products, Products

SEARCHNAME

Jalla Coffee FILTER 500G

Seach name

Released Products

PRODUCTDESCRIPTION

Jalla Coffee Original is a useful coffee that can be enjoyed on most occasions. A carefully selected mix of coffee types, mainly from Brazil, guarantees a round and full-bodied coffee with long aftertaste

Full item description

Released Products, Products

PRODUCTSUBTYPE

Product

Should always be “product”

Released Products, Products

PRODUCTTYPE

Item

Item or Service

Released Products, Products

STORAGEDIMENSIONGROUPNAME

SiteWhLoc

Name of the storage dimension group

Released Products, Products

ISPURCHASEPRICEAUTOMATICALLYUPDATED

Yes/No

Should last purchase price be updated automatically

Released Products

ISUNITCOSTAUTOMATICALLYUPDATED

Yes/No

Should cost purchase price be updated automatically

Released Products

PRODUCTGROUPID

WHI

WHI(warehouse controlled) or, SRV(service)

Released Products

INVENTORYUNITSYMBOL

PCS

Inventory unit

Released Products

PURCHASEUNITSYMBOL

PCS

Purchase unit

Released Products

SALESUNITSYMBOL

PCS

Sales unit

Released Products

PURCHASEPRICE

0

Latest purchase price in local currency

Released Products

UNITCOST

0

Latest cost price Sin local currency

Released Products

SALESPRICE

0

Default sales price in local currency

Released Products

NETPRODUCTWEIGHT

0,5

Weight of the product

Released Products

PRIMARYVENDORACCOUNTNUMBER

20086

Primary vendor

Released Products

PURCHASESALESTAXITEMGROUPCODE

Middle

Purchase item tax groups

Released Products

SALESSALESTAXITEMGROUPCODE

Middle

Sales item tax groups

Released Products

BUYERGROUPID

P108

Grouping related to buyergroup

Released Products

TRACKINGDIMENSIONGROUPNAME

None

Tracking dimension

Released Products, Products

BASESALESPRICESOURCE

PurchPrice

Base sales prices on purchase price ?

Released Products

DEFAULTORDERTYPE

Purch

Standard verdier

Released Products

ITEMMODELGROUPID

FIFO

item model group

Released Products

PRODUCTCOVERAGEGROUPID

Min/Max

Coverage group

Released Products

COUNTGROUPID

PER

Gcount group

Released Products

PURCHASEPRICEQUANTITY

1

Purchase price quantity

Released Products

UNITCOSTQUANTITY

1

Cost price quantity

Released Products

DEFAULTLEDGERDIMENSIONDISPLAYVALUE

-D30-320—P108

Financial dimensions(=”-D30-320—“&B34)

Released Products

Product Dimension

P108

Just a helping colum

Help column for DefaultLedgerDimension

ProductCategoryHierarchyName

Retail category

Retail hierarcy name

Product category assignments

ProductCAtegoryName

Coffee

Category node

Product category assignments

VendorProductNumber

4001392

Vendors item number

External item descriptions for vendors

VendorProductDescription

Jalla Coffee FILTER 500G

Vendors item name

External item descriptions for vendors

VendorAccountNumber

20086

Vendor number

External item descriptions for vendors

BARCODESETUPID

EAN13

Barcode type

Item – Bar Code, Released products

BARCODE

7041011050007

Barcode

Item – Bar Code

PRODUCTQUANTITYUNITSYMBOL

PCS

barcode unit

Item – Bar Code

ISDEFAULTSCANNEDBARCODE

Yes

Scanning yes/no

Item – Bar Code

PRODUCTQUANTITY

1

Barcode quantity

Item – Bar Code

PURCHASEUNDERDELIVERYPERCENTAGE

20

Purchase under delivery percentage allowed

Released Products

PURCHASEOVERDELIVERYPERCENTAGE

20

Purchase over delivery percentage allowed

Released Products

MINIMUMPROCUREMENTORDERQUANTITY

x

Minimum purchase quantity

Default Order Settings

MAXIMUMPROCUREMENTORDERQUANTITY

x

Maximum purchase quantity

Default Order Settings

STANDARDPROCUREMENTORDERQUANTITY

x

Standard purchase quantity

Default Order Settings

PROCUREMENTQUANTITYMULTIPLES

x

Multiple purchase quantity

Default Order Settings


The template excel spread sheet columns should contain exactly the columns as listed above:

Then start building the excel spread sheet (this is the time consuming part). This can also be regarded as the “master file” for products. And mass update and mass import of products is done using this file. Remember that you can add more columns and also include calculated fields. Like in this case, the default dimension (used for financial dimension have the formula like =”-D30-320—“&B34 making sure that cell B34 is merged into the financial dimension.

Create the data management import project.

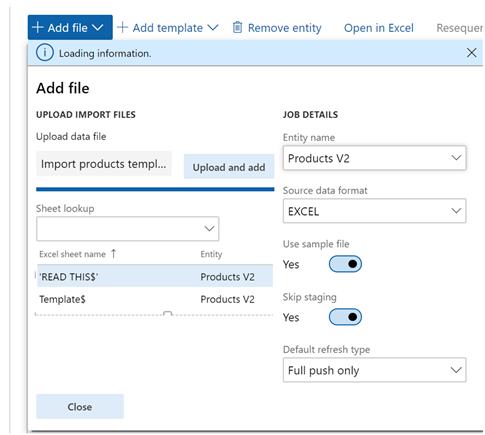
In the data management workspace, create a import project, and use the “+ Add file”, and select the excel file by using the “upload and add”. Then select all the entities and what page in the excel spread sheet that should be imported.

– Select file
– Select entity name
– Select sheet lookup
– Then repeat by select entity name and sheet lookup until all date entities needed are selected

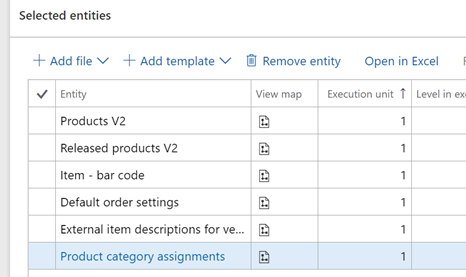
After done this correctly you should have an import project with the following entities:

You should also click on the “view map” symbol if there are a warning, and just delete the lines where there are no mapping generated. Like what I have done here to the “Products V2” entity.

The mapping will be done automatically for you, and will only select the fields that is relevant for each data entity.

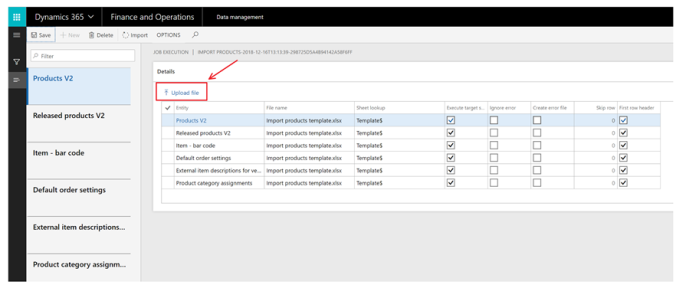
Your data entity is now ready to be used. I recommend to use the data management workspace, and select the import project and then “run project”

Then for each data entity I upload exactly the same excel spreadsheet :

And then click on the “import”. If there are any errors, then fix them in the excel sheet or make changes to the staging.

What we then have accomplished is to have a single excel spreadsheet that the category manager can maintain and work with, and it can uploaded(several times) into the import project. For trade agreement sales and purchase prices I normally recommend creating a separate excel spread sheet

Then the excel loving category managers will be happy, and they can import thousands of products in a very short time


D365F&O Retail: Combining important retail statement batch jobs

The Retail statement functionality in D365F&O is the process that puts everything together and makes sure transactions from POS flows into D365F&O HQ. Microsoft have made some improvements to the statement functionality that you can read here : https://docs.microsoft.com/en-us/dynamics365/unified-operations/retail/statement-posting-eod. I wanted to show how to combine these 3 processes into a single batch job.

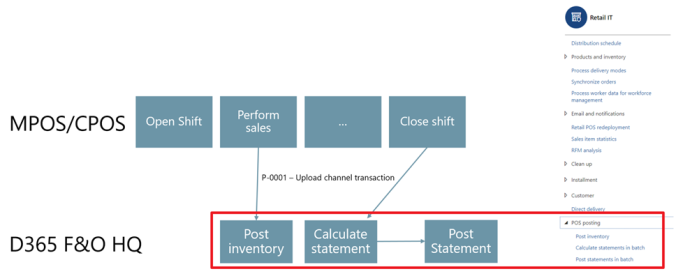
The following drawing is an oversimplification of the process, but here the process starts with the opening of a shift in the POS (with start amount declaration), and then start selling in POS. Each time the job P-0001 upload channel transaction is executed, the transactions are fetched from the channel databases, and imported to D365F&O. If you are using shift-based statements, a statement will be calculated when the shift is closed. Using shift-based closing can be tricky, but I highly recommend doing this! After the statement is calculated and there are no issues, the statement will be posted, and an invoiced sales order is created. Then you have all your inventory and financial transactions in place.


What I often do see, is that customers are using 3 separate batch jobs for this. The results in the user experience that the retail statement form contains many calculated statements waiting for statement posting. Some customers say they only want to see statements where there are issues (like cash differences after shift is closed).

By combining the batch jobs into a sequenced batch job, then the calculated statements will be posted right again, instead of waiting until the post statement batch job is executed. Here is how to set this up:

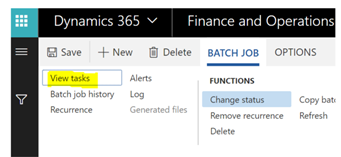
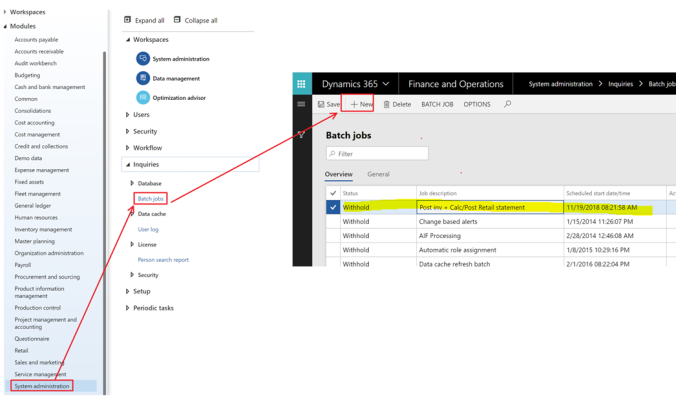
1. Manually create a new “blank” batch job


2. Click on “View Tasks”.

3. Add the following 4 classes:

RetailCDXScheduleRunner – Upload channel transaction (also called P-job)

RetailTransactionSalesTransMark_Multi – Post inventory

RetailEodStatementCalculateBatchScheduler– Calculate statement

RetailEodStatementPostBatchScheduler – Post statement

Here I choose to include upload of transactions, post inventory, calculate statement and post statement into a single batch-job.

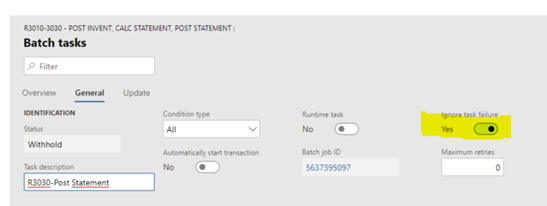
Also remember to ignore task failures.

And remember to click on the “parameters” to set the parameters on each task, like what organization notes that should be included.

On each batch task I also add conditions, so that the previous step needs to be completed before the batch-job starts on the next.

Then I have 1 single batch job, and when executing it spawns subsequent tasks nicely.

The benefit of this is that when you are opening the statements workspace you mostly see statements where there are cash differences, or where the issues on master data.

Take case and post your retail statements.


Report your bugs, free-riders!

Microsoft Dynamics 365 is the fastest innovation and most agile business software in the world. A very feature rich solution with a packed very fast moving roadmap. We see new possibilities and features coming monthly in platform update, fall/spring releases. if you look at the entire platform-stack including windows, office, and platform (power* apps) new features being made available on a daily basis. Being first and fast have changed and challenged the Dynamics 365 ecosystem. Mostly for the good.

But we have to recognize that it is people (and highly productive) behind this innovation tsunami. In such an environment there are thousands of elements that must to fit together. If you look towards the number of combinations on how you can use and setup Dynamics 365, I would assume that this is millions of combinations in the core product. And when adding office and power* apps, combinations just increases exponentially.

People are people, and there is a limitation to the numbers of combinations that can be tested, both from a manual and automated testing scenario. This leads to scenarios that there is no capacity to test everything before the product is released. It is not possible to test all of the millions of combinations, and I know that even Microsoft do not have unlimited people and resources to cover every test scenario.

This evidently results in issues and bugs that will be found when implementing Dynamics 365, and these needs to be reported to Microsoft support so that the fixes becomes part of the future solution.

Searching, testing, reporting a solution takes time and do cost money! Each time I find a bug, I report this to Microsoft so that all of the community can benefit of a fix. But as some have recognized that reporting issues/bug is requiring effort and resources. You report the bug, analyze the issue, report the issue, Microsoft provides hotfixes, the hotfix needs to be validated and testing and then deployed to the environment. This takes time, but is necessary!

With this blog post I urge both partners and customers to report your findings to Microsoft, so that all the rest of us can benefit that we are an ecosystem together. As I hope most of you know, we are quickly moving towards Dynamics 10, that is often referred to as the “ever-green” solution. This means that there are ONE version, that all customers are using, and that follows the Microsoft roadmap. When one customer reports an issue, and it is fixed, then all benefit from this.

Then there is the issue with the “free-riders”. These are the people that recognize the issue, find workarounds and DON’T take the investment in time and resources of reporting the issue. They know and see the issue, but choose to live with it or ignore it. Then in many cases, Microsoft if not even aware of any issue, and the issues just continues to be present in future releases. The best way is to report what you see to Microsoft support or to Microsoft ideas. Then Microsoft can take action on it, because they know of it.

So, I urge my fellow community friends to not be a Free-Rider, but report your issues. This will ensure that we all can share the resource/time burden among us, and we also improve and strengthen Dynamics 365, that we all will benefit from.

PS! Dynamics 365 is the BEST business application in the world!

Vote on Dynamics 365 ideas

Do you know that you can influence the direction of Dynamics 365? But you may be unsure as to whether it really will make a difference. Microsoft have a site where the community can add ideas and vote on them. Go to https://experience.dynamics.com/ideas/ and create your ideas. If the idea is valid and they get enough votes, Microsoft will act and include them in their product backlog. But equally important is the ability to vote on other’s ideas.

  • Voting is the most important way to make the community voice heard on the issues that concerns the roadmap for Dynamics 365.
  • Voting gives you an opportunity to be part of the priority that affects Dynamics 365.
  • If YOU don’t Vote Others will make the decisions for YOU!

As we speak, there are 1673 ideas for Microsoft Dynamics 365 for Finance and Operations and 212 ideas for Microsoft Dynamics 365 for Retail. Microsoft employees are some of most actives to add ideas to their site.

The ideas portal allows you to see as the ideas more from an idea to being part of the product:

An important unofficial note is that for an idea to be moved from “New” to “Under Review” it requires at least 10 votes. Also discussions is possible on the ideas, and to add additional substance to the requirements.

You can also keep track of your own ideas and votes you have submitted.

If I have a few minutes of spare time, I like to go in and look at the new ideas submitted and read them. When there are ideas I like, I vote on them.

The more we use this channel to give ideas and feedback, the more important it will be. So please go in and vote at https://experience.dynamics.com/ideas/

(And if you find some of mine, please give it a vote )

MSDYN365FO: Automate repetitive tasks – the easy way

Here the other day, I got the task of posting a few thousand Retail Kit orders / BOM-Journals because they failed at the first time. I started, and managed to manually post 50 journals before my fingers got cramps and I started to feel dizzy. I could not multiselect the journals and post them, so I had to manually click “post” on each journal.

I surely sent a SR to Microsoft explaining that this should be easier in standard, and that SR is in process. But it will probably end up as a “As-Designed” state, or “post it to ideas.microsoft.com”.

But there is an easier low-tech way to solving this. Just install a Mouse-ghost app, and it will repeat the task for you. So I used the app “Mouse Recorder Premium” to post all the 1300 journals, and it went smoothly. Just record the clicks and then repeat for a 1000 times.

To make sure I did not “lock” my PC while this was performing, I started the task in a Hyper-V VM, and then it can run in the background.

That’s today’s small trick to get rid of repetitive tasks

Measure sales per Retail Category in Power BI

Drill down on sales per category, employee, and department is key essentials for Retailers. Doing this gives a more specific view of what’s generating sales and what isn’t. Having insights into top categories or departments might help make decisions about purchasing and marketing. A good point of sale comes with reporting and analytics, so you can quickly get the data you need, whenever you need it — without manual calculations.

Power BI is a must have for all retailers, and this blogpost is about creating a retail category hierarchy in power BI.

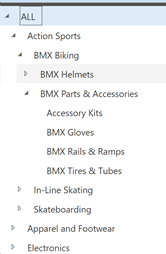
If you have worked with Retail Categories, you know that there exists a “parent-child” relationship between the categories as illustrated from the following data in the Contoso demodata set.

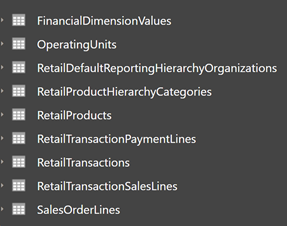
In power BI it is possible to also create such hierarchies, but it requires some minor changes to reflect this. My inspiration came from Power BI Tutorial: Flatten Parent Child Hierarchy. I will not go through how I build a retail power BI analysis, but I can share that I use ODATA entities, and here is the entities I’m using:

More information on the data model is available in DOCS her.

The “trick” is to create a new column named “Path“, and a column named CategoryL[X] for each level in the hierarchy, that for the RetailProductHierarchyCategories looks like this:

Here are the column formulas

Path = PATH(RetailProductHierarchyCategories[CategoryName];RetailProductHierarchyCategories[ParentCategoryName])

CategoryL2 = PATHITEM(RetailProductHierarchyCategories[Path];2)

CategoryL3 = PATHITEM(RetailProductHierarchyCategories[Path];3)

CategoryL4 = PATHITEM(RetailProductHierarchyCategories[Path];4)

CategoryL5 = PATHITEM(RetailProductHierarchyCategories[Path];5)

…etc

Then I create a new hierarchy column for, where I specify

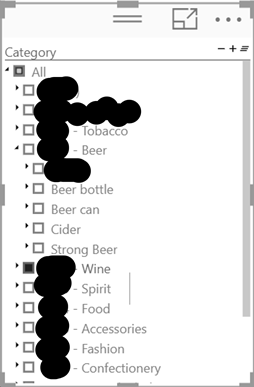
And I use the Hierarchy Slicer that is available in the power BI marketplace.

In power BI I then get a Retail Category slicer, and can filter and measure sales per category in power BI

Microsoft are in process of aligning ourselves with future of Power BI and create the new version of Retail Channel Performance with New Common Data Service for Analytics capability coming to Power BI https://powerbi.microsoft.com/en-us/cds-analytics/

Keep on rocking #MSDYN365FO!

Failed ERP implementation will change partners to become trusted advisors.

A norwegian customer won a compensation case against an ERP implementation partner after the customer terminated the parties’ agreement on the supply of a new ERP. The customer was compensated by the Norwegian district court assessed at 288 mNOK (36,7 mUSD). Originally the contract was worth 120 mNOK. You can read the complete story here http://www.selmer.no/en/nyhet/felleskjopet-agri-wins-district-court-case. The court decision is expected to be appealed.

Luckily this was NOT a Dynamics 365 implementation, and the customer is actually replacing the failed ERP system with Dynamics 365. The reason why I wanted to write about this story is that it has implications on how much risk and responsibility an ERP implementation partner can take. A major part of the ERP partners are smaller companies with less than 100 employees, than cannot take the risk of getting into such a situation. There are always problems and risks that is beyond what a ERP partner can control. Partners are not the developer company of the standard software. They are implementing, and in some cases adding additional extensions. Also the cloud based software are running on azure that is beyond the control of the partner.

How can this change partners behavior? Partners are changing towards becoming verticalized trusted advisors, but with limited responsibilities. We can give recommendations based on what we know about the software and how to use it efficiently but the costs are more on a T&M(Time and Material) basis. It will more be the customer them selves that is responsible for the implementation and time-tables.

Some customers will not accept this change, but other do. There are currently resource constrains in the Dynamics 365 partner channel and we partners avoiding customers that takes a back-seat approach towards their implementation projects. The sales focus will change towards those customers that take more of the responsibility themselves, and that do understand to take a more dynamic and agile approach. A 400-page requirement document is not a good start for an ERP project, as we see the digitalization possibilities are accelerating. We also see that customers don’t run a 2 year ERP implementation project before going live. They run a 90 days project to get live with only parts of their requirements. The project then takes on other areas and they extend their use of the Dynamics 365.

At the end, I include some trusted advisor recommendations that I think can inspire anyone that is about to start a project.